Gold takes a bearish punch on chin – An update on Trading Signal!
Gold recently has formed a Doji candle which is representing a tug of war between bears and bulls. It means the bulls are likely to take...
Our earlier forecast on gold ‘Gold violates descending triangle pattern‘ did pretty well as the market gold prices plunged dramatically to hit our suggested level of $1,197. What’s next?
On Monday, gold prices fell below $1,200 to their lowest since late January 2017. Most of the selling trend was initiated on a strong dollar as investors tried to shelter from a financial market rout triggered by a crashing Turkish lira.
Earlier today, we shared a forex trading signal to open a buying position above $1,196 to target $1,199. The logic behind this trade is pretty simple. If you take a look on the 4-hour chart, gold has gone massively oversold after yesterday’s sell-off.
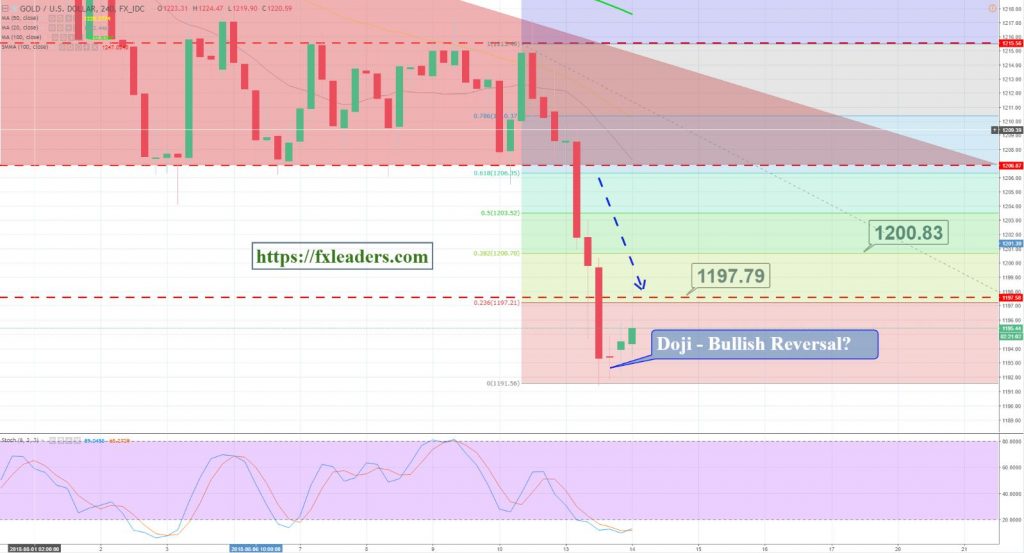
Gold – 4 Hour Chart
It has recently formed a Doji candle, which is representing a tug of war between bears and bulls. It means the bulls are likely to take over from here. Gold can go for retracement until $1,197 (23.6% Fibo level) and $1,200 (38.2%) level before taking another dip.
Good luck!
- Check out our free forex signals
- Follow the top economic events on FX Leaders economic calendar
- Trade better, discover more Forex Trading Strategies
- Open a FREE Trading Account
- Read our latest reviews on: Avatrade, Exness, HFM and XM
Related Articles
Sidebar rates
Related Posts
