SHIB/USD Coin Sideways at $0.0000060 – Triangle Pattern in Play
The SHIB/USD coin failed to stop its early-day declining streak and drew some further offers near the $0.00000620 level. The downfall in the
Written by:
Arslan Butt
•
Monday, August 2, 2021
•
2 min read
•
Last updated: Monday, August 2, 2021
The SHIB/USD Coin failed to stop its early-day declining streak, drawing further offers near the $0.00000620 level. The downfall in the SHIB coin could be tied to the mixed market conditions. It should be noted that Bitcoin failed to maintain its upward bias of the previous week, and started a downside correction against the US Dollar, from the $42,600 zone.
Weakness in Bitcoin Weighs on the SHIB/USD Coin, at $0.0000064
The
BTC is now trading below $40,000, and it might extend losses towards $38,500. In that case, other cryptocurrencies, like
Dogecoin, SHIBA INU, and Ethereum, will follow Bitcoin’s downward lead. Ethereum (
ETH/USD, -3.76%) was recently trading off around 5% on the day, while Dogecoin (
DOGE/USD, -2.65%) was down around 3.5%.
The SHIBA INU is trading near $0.00000633, with a 24-hour trading volume of $257,174,320. SHIBA INU has dropped by 2.61% in the past twenty-four hours. On the positive side, the multi-asset investment platform, eToro, has listed Shiba Inu (SHIB). The company argues that the decision came following substantial demand from customers. e-Toro was founded in 2006. It is an Israeli social trading and multi-asset brokerage company. It announced the listing of Shiba Inu (SHIB) in a recent press release shared via CryptoPotato.
The statement says that the decision was made, due to “strong customer demand.” This would provide customers with a “clearer understanding of the pricing in a regular, two-decimal-point format.” So, the positive development surrounding the SHIBA INU could help to limit deeper losses in its prices.
Weaker Dollar to Underpin SHIB/USD Coin at $0.00000612
The weakness of the broad-based US dollar, backed by the risk-on market sentiment, was also seen as one of the major reasons that capped any additional losses in the SHIB/USD coin pair. The US dollar index, which measures the greenback versus 6 major peers, stood at 92.091, dropping as low as 91.775 for the first time since June 28.
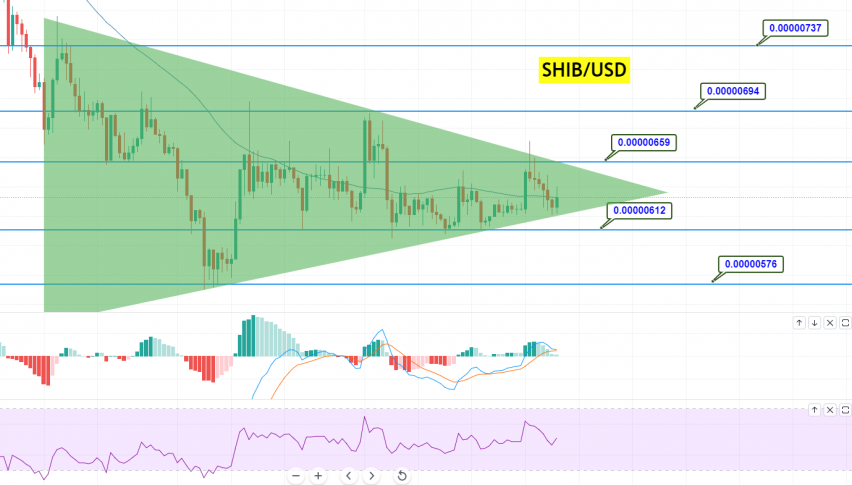
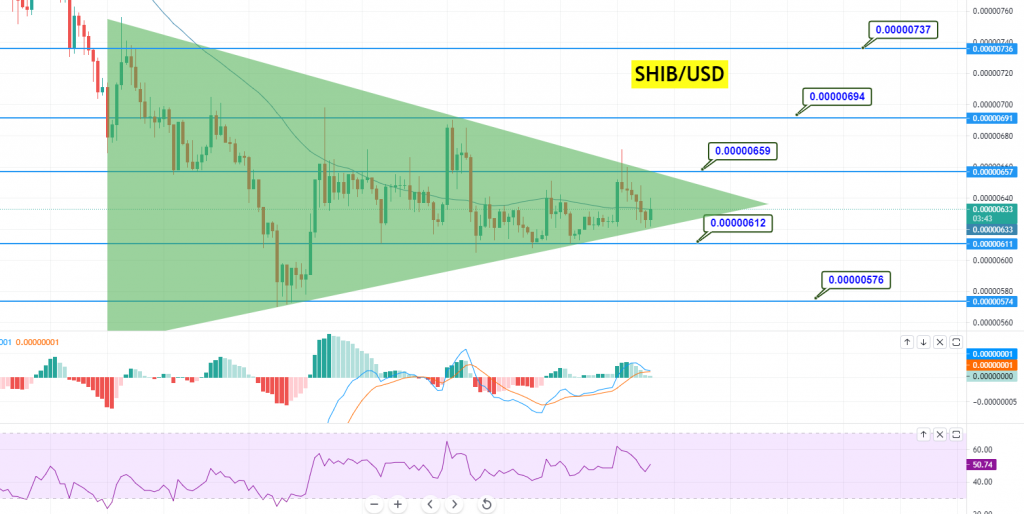
SHIB/USD Coin Price Forecast – Symmetrical Triangle Underpins at $0.0000061
On the technical front, the SHIB/USD coin is trading sideways at the 0.0000063 level. On the 4-hour timeframe, the SHIB/USD coin has closed a symmetrical triangle pattern that is supporting the coin at $0.00000612. The downward trendline is likely to provide resistance at the $0.0000065 level.
On the lower side, a bearish breakout at the 0.00000612 level could trigger sharp selling until 0.00000576. Conversely, a breakout at the 0.0000065 level could lead the coin price towards the 0.0000069 resistance level. The MACD and RSI are neutral, as they are both tossing above and below the crossover levels. Let’s consider choppy trading until a breakout within the 0.0000065 to 0.0000061 range. Good luck!
Arslan Butt
Lead Markets Analyst – Multi-Asset (FX, Commodities, Crypto)
Arslan Butt serves as the Lead Commodities and Indices Analyst, bringing a wealth of expertise to the field. With an MBA in Behavioral Finance and active progress towards a Ph.D., Arslan possesses a deep understanding of market dynamics.
His professional journey includes a significant role as a senior analyst at a leading brokerage firm, complementing his extensive experience as a market analyst and day trader. Adept in educating others, Arslan has a commendable track record as an instructor and public speaker.
His incisive analyses, particularly within the realms of cryptocurrency and forex markets, are showcased across esteemed financial publications such as ForexCrunch, InsideBitcoins, and EconomyWatch, solidifying his reputation in the financial community.