Booking Profit on Crude Oil, as it Dives on Softening Global Sentiment
Crude Oil is making a strong case for a bullish reversal on larger time-frame charts
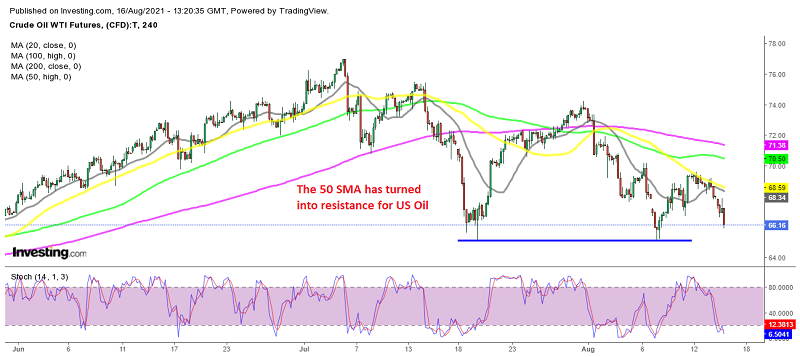
Crude oil has been showing increasingly bearish signs since the first week of July, when it reversed lower at $77. Buyers have tried to resume the bullish trend, but their attempts have failed and the highs have been getting lower since then.
We have made some decent profit selling the bounces in oil in recent weeks, and the last trade just closed in profit, as you can see from our forex signals section. Moving averages suggest a trend reversal, since they were providing support when oil was on the way up, while now they have turned into resistance. We decided to sell the last retrace higher at the 20 SMA (gray) on the H4 chart, with the stochastic indicator oversold back then.
The 50 MA has turned into resistance for crude oil now
Buyers pushed higher, reaching the 50 SMA (yellow) on this chart, but they couldn’t break above the 50 SMA (yellow), which kept pushing WTI Oil lower, until it reversed down and rumbled today. We booked around 170 pips in profit on our trade here, so we’re doing well in oil. The latest bounce never really got going in crude oil, as it was already fading slowly, with traders leaning more towards being risk-averse at the start of the new week.
US Crude Oil Live Chart
The new measures, due to the delta variant of the coronavirus are hurting the sentiment, with China and Japan in lock-downs, while manufacturing in the US is already softening in August, as shown below, although this might not be related to the coronavirus.
New York Fed Empire manufacturing index for August 2021
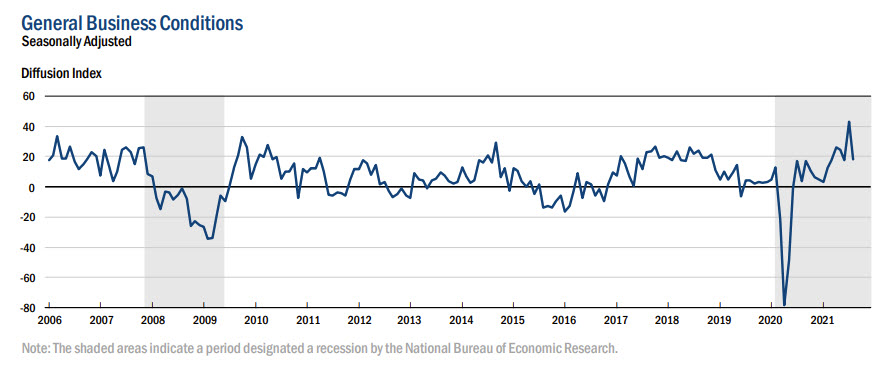
- August Empire Fed manufacturing index 18.3 versus 28.9 estimate
- Prior report came in much stronger than expected, at 43.0 versus 18.0 expected (record high)
- new orders 14.8 versus 33.2 last month
- prices paid 76.1 versus 76.8 last month
- prices received 46.0 versus 39.4 last month
- employment 12.8 versus 20.6 last month
- average workweek 8.9 versus 14.0 last month
- shipments 4.4 versus 43.8 last month
- unfilled orders 15.0 versus 12.1 last month
- delivery time 20.3 versus 20.2 last month
- inventories 6.2 versus 16.2 last month
Six-month conditions rose to 46.5 versus 39.5 last month
- new orders 42.7 versus 34.2 last month
- prices paid 66.4 versus 64.6 last month
- prices received 52.2 versus 57.6 last month
- number of employees 38.5 versus 43.9 last month
- average workweek 2.7 versus 3.0 last month
- shipments 45.9 versus 39.9 last month
- unfilled orders 0.0 versus 1.0 last month
- delivery times 0.9 versus 5.1 last month
- inventories 8.0 versus 9.1 last month
- capital expenditures 23.0 versus 26.3 last month
- technology spending 15.0 versus 14.1 last month
- Check out our free forex signals
- Follow the top economic events on FX Leaders economic calendar
- Trade better, discover more Forex Trading Strategies
- Open a FREE Trading Account
- Read our latest reviews on: Avatrade, Exness, HFM and XM
Related Articles


Sidebar rates
Related Posts
