The 50 SMA Holds for Nikkei
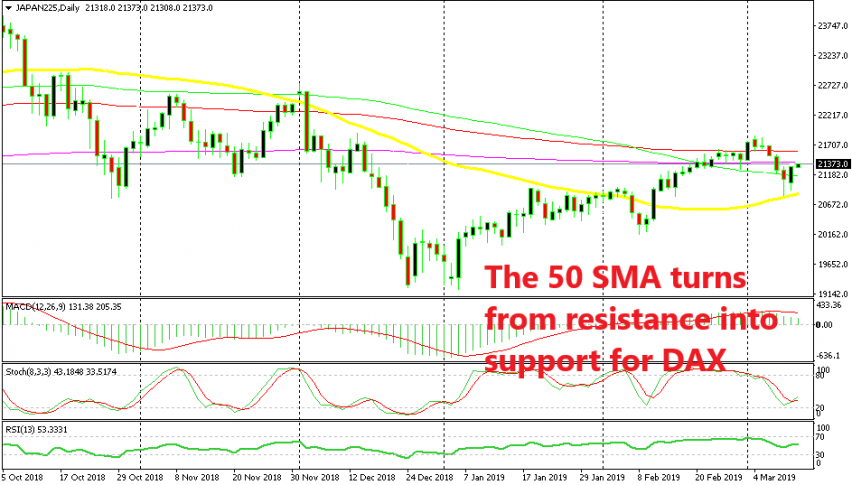
Nikkei225 retraced lower last week but the decline stopped at the 50 SMA and it is now reversing higher
Stock markets declined last week as we have mentioned quite a few times today, but it seems as the decline might be over. They closed Friday with a bullish reverse in the US session and some of them formed a pin candlestick on the daily chart, which means that a bullish reverse might follow on this time-frame.
Today, they have been sort of uncertain during the European and Asian sessions, but are making a move higher now during the US session which has started an hour earlier. NIKKEI225 declined to the 50 SMA (yellow) on the daily chart on Friday. This moving average has been providing resistance for Nikkei before but now it seems to have turned into support.
It is standing at 20,820 right now and that’s where the decline stopped. So, this might be the end of the downtrend for stocks and for Nikkei in particular. The stochastic indicator is nearly oversold, just like in the beginning of February, which was followed by a reversal higher and a continuation of the bullish trend.
We are already long on the German DAX, so we won’t pull a trade here, but you can consider it if it suits your risk/reward ratio.
- Check out our free forex signals
- Follow the top economic events on FX Leaders economic calendar
- Trade better, discover more Forex Trading Strategies
- Open a FREE Trading Account
Related Articles


Comments
Sidebar rates
Related Posts
