Oil Rebounds 1% to $58 as Trendline Tested After 20% Drop Since April
Oil prices up 1% as WTI tests key resistance level After 6 days of losses, WTI crude recovers slightly from its lowest levels since Feb 2021
Quick overview
- Oil rebounds 1% after touching February 2021 lows.
- OPEC+ output hike adds pressure despite short-term dip buying.
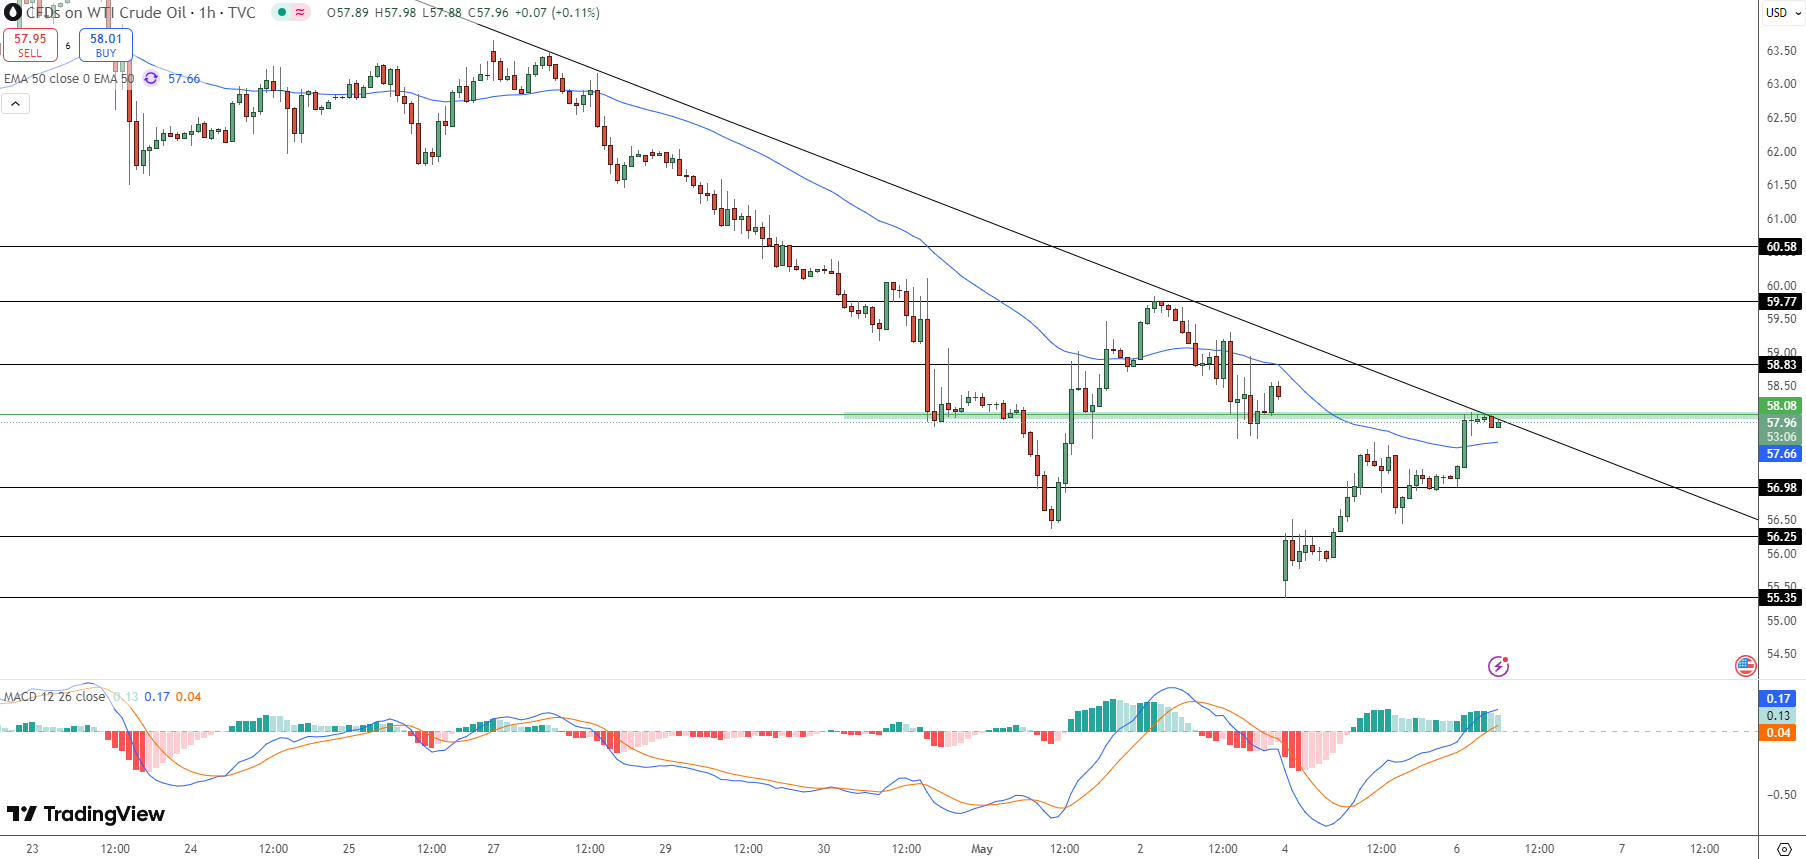
- WTI tests $58.08 resistance amid bullish MACD crossover.
- Barclays cuts forecast for 2025 Brent to $70 per barrel.
Oil prices up 1% as WTI tests key resistance level After 6 days of losses, WTI crude recovers slightly from its lowest levels since Feb 2021
This bounce is technical, driven by dip-buying after an extended downtrend. Traders are watching as WTI approaches the descending trendline, a level that has capped rallies for the past few weeks. A break above could be a short term sentiment shift.
OPEC+ surprised the market by increasing output for the 2nd month in a row. Add to that oversupply fears and oil has fallen 20% since early April when Trump announced new tariffs.
Mixed Fundamentals
While the rally is good for bulls, fundamentals are still cloudy. Analysts like Yeap Jun Rong at IG say the price recovery is more technical than demand driven. “Persistent headwinds like OPEC+ output, tariff driven demand risks and weaker forecasts are still weighing on oil,” he said.
Chinese market reopened after 5 day holiday and demand picked up with traders in the world’s largest crude importer buying up cheaper barrels. US services PMI surprised to the upside at 51.6 in April vs 50.2 expectations. Oil demand looks resilient.
But Barclays cut its Brent forecast by $4 to $70 for 2025 citing a “rocky road” ahead due to geopolitical tensions and supply pressures. Fed is also expected to keep rates on hold this week as economic uncertainty mounts and that will add to the oil outlook.
Trade Setup: Breakout or Bull Trap?
From a technical perspective, WTI is testing the $58.08 level which is a key resistance. 50 period EMA is now the near term support and MACD has turned positive.
Here’s the setup:
-
Entry: Buy above $58.08 on strong volume
-
Targets: $59.77 (swing high) and $60.58 (major resistance)
-
Stop-loss: Just below $57.50 to manage risk
Breakout or bull trap?
Summary Bullet Points:
-
Oil rebounds 1% after touching February 2021 lows
-
OPEC+ output hike adds pressure despite short-term dip buying
-
WTI tests $58.83 resistance amid bullish MACD crossover
-
Barclays cuts forecast for 2025 Brent to $70 per barrel
-
Breakout setup forming, but trendline remains unbroken
- Check out our free forex signals
- Follow the top economic events on FX Leaders economic calendar
- Trade better, discover more Forex Trading Strategies
- Open a FREE Trading Account
- Read our latest reviews on: Avatrade, Exness, HFM and XM
Related Articles
Sidebar rates
