The Trend Remains Still Bearish for USD/CAD, As Long As MAs Hold
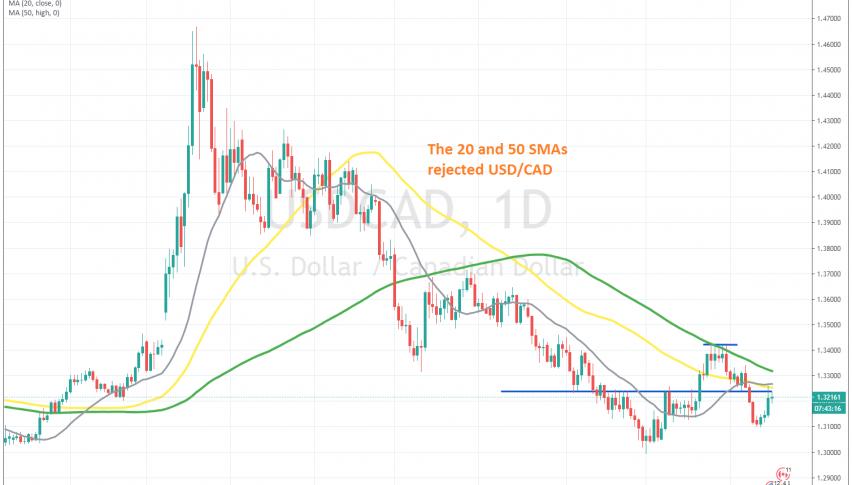
USD/CAD retraced higher yesterday, but the retrace ended at the 50 SMA on the daily chart

[[USD/CAD]] has been bearish since March, following the surge higher from the coronavirus panic. The surge took this place 15 cent higher, but the decline has been bigger, taking USD/CAD around 17 cents lower and pushing it below the big round level at 1.30.
Although, the price didn’t stay too long below 1.30 and it started reversing higher in September, climbing more than 400 pips up. Some USD/CAD traders were hoping for a bullish reversal, but it turned out to be nothing more than a retrace higher before the price turned bearish again during the first two weeks of September.
The 100 SMA (green) stopped the climb on the daily chart and USD/CAD stared declining again, but yesterday we saw an other retrace higher. Although, this time the retrace ended lower, where the 50 SMA (yellow) and the 20 SMA (grey) were meeting. They provided resistance and the climb has stopped. We might open a sell forex signal from around here, but will see how crude Oil reacts because it is falling down, which is weakening the CAD.
- Check out our free forex signals
- Follow the top economic events on FX Leaders economic calendar
- Trade better, discover more Forex Trading Strategies
- Open a FREE Trading Account


