Ascending Triangle Pattern & Gold – Ready To Buy?


Today in the early Asian session, the gold surged to test $1270 as investors hiked their demand for haven assets due to North Korea's additional ballistic missile test.
In reference to the Forex Signals Brief for May 30th, North Korea is doing this test for the 9th time this year. For us, the most surprising thing is that event came right after the G7 meeting where countries pledged to exert more pressure on North Korea to stop them from launching more tests.
In the meantime, the elections in the United Kingdom are adding concerns about the political risk surrounding Brexit.
Forex Trading Signal
Considering the demand for haven securities, I have opened a buy signal at $1264 with a stop loss below $1259 and a take profit of $1267.
 Gold – 4 Hours Chart
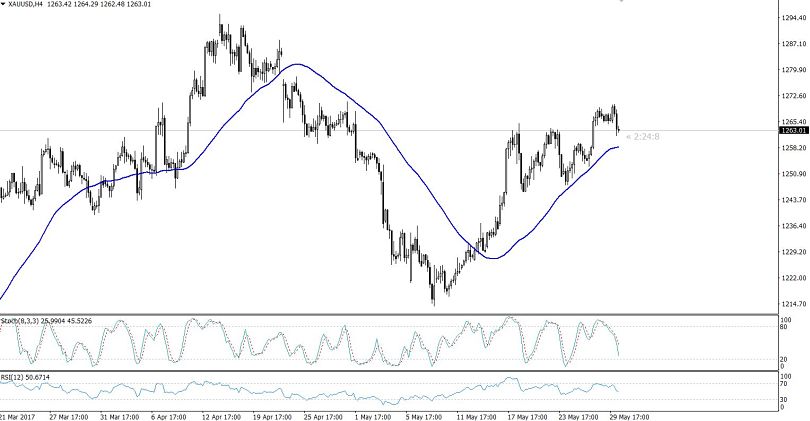
Technical Outlook- Intraday
Gold has traded in line with the predictions recorded in, What If Gold Breaks Above $1270? – U.S. Political Tensions In Focus. Investors were recommended to enter a buy position above $1263, having placed a stop loss below $1259 and a take profit above $1270.
At this point, the gold has broken below a significant support level of $1263, after testing $1270. Consequently, the gold has the potential to test $1259, placing our forex trading signal on risk.
Technical Trading Levels – Intraday
S1: 1252.64 R1: 1262.04
S2: 1243.23 R2: 1267.85
S3: 1237.42 R3: 1277.2
Now let's cross our fingers and wait and see if the U.S. economy fundamentals manage to support our buying positions.