Bustling Week With Major Trade Opportunities – 1 – 5 of May Weekly Forecast


Before we start talking about May, let us appreciate April for offering us such incredible forex trading signals. It really was a busy month with a lot of startling economic events. The story began with the geopolitical problems between the United States, North Korea, and Syria. The United Kingdom provided the global markets with another shock as a consequence of British Prime Minister Theresa May call for early general elections. The story didn't end there. The French elections caused a massive fluctuation along with huge gaps not only in the forex but also in the equity and bullion market.
Traders, as usual, the first segment of the report includes a fundamental analysis, while the second segment includes technical analysis and forex trading signals.
The Week Ahead – What To Look For?
On Monday, most of the European markets will remain closed in observance of Labor day, which may result in thin liquidity. However, the ongoing developments around the globe, particularly the French election, will remain in focus before the second round of voting on May 7th.
Besides this, we can't ignore that the conflict between North Korea and the United States is gaining momentum, especially after the harsh warnings issued to South Korea about getting pulled out of the free trade agreement. Let's take a look at the economic events worth watching this week:
USD
- Treasury Sec Mnuchin Speaks (Monday – 12:45)
- ISM Manufacturing PMI (Monday – 15:00)
- ADP Non-Farm Employment Change (Wednesday – 13:15)
- ISM Non-Manufacturing PMI (Wednesday – 15:00)
- Crude Oil Inventories (Wednesday – 15:30)
- FOMC Statement (Wednesday – 19:00)
- Federal Funds Rate (Wednesday – 19:00)
- Unemployment Claims (Thursday- 13:30)
- Average Hourly Earnings m/m (Friday – 13:30)
- Non-Farm Employment Change (Friday – 13:30)
- Unemployment Rate (Friday – 13:30)
- Fed Chair Yellen Speaks (Friday – 18:30)
EUR
- EU Economic Forecasts (Monday – 10:00)
- Spanish Manufacturing PMI (Tuesday- 08:15)
- Spanish Unemployment Change (Wednesday- 08:00)
- German Unemployment Change (Wednesday- 08:55)
- Prelim Flash GDP q/q (Wednesday- 10:00)
- ECB President Draghi Speaks (Wednesday- 17:30)
- French Presidential Election (Sunday – All Day)
GBP
- Manufacturing PMI (Tuesday – 9:30)
- Construction PMI (Wednesday – 9:30)
- Services PMI (Thursday- 9:30)
- Net Lending to Individuals m/m (Thursday- 9:30)
JPY
- Final Manufacturing PMI (Monday – 1:30)
- Monetary Base y/y (Tuesday- 0:50)
- Monetary Policy Meeting Minutes (Tuesday – 0:50)
- BOJ Core CPI y/y (Tuesday – 6:00)
CAD
- Trade Balance (Thursday – 13:30)
- BOC Gov Poloz Speaks (Thursday – 21:25)
- Employment Change (Friday – 13:30)
- Unemployment Rate (Friday – 13:30)
- Ivey PMI (Friday – 15:00)
AUD
- Cash Rate (Tuesday- 5:30)
- RBA Rate Statement (Tuesday- 5:30)
- Trade Balance (Thursday – 2:30)
- RBA Gov Lowe Speaks (Thursday – 4:10)
- RBA Monetary Policy Statement (Friday- 2:30)
EUR/USD – The Most Highlighted Pair
Just like this past week, the pair is likely to consolidate in a range as investors are waiting for the final round of the French election results, scheduled for May 7th.
Besides this, the Federal Reserve Open Market Committee (FOMC) and Non-Farm Employment Change will be under the spotlight as they have high potential to shake the market. The Eurozone economic event's including Prelim Flash GDP q/q and Labor market figures will also have their influence on the market.
.jpg)
EURUSD – Weekly Chart
Technical Outlook – Weekly
The pair is trading slightly bullish. The pair opened with a massive gap in prices and it failed to fill the gap over the previous week. One interesting thing about this pair is that in the weekly timeframe, the pair has closed below 50 periods EMA. In addition, It has also formed a neutral candlestick pattern known as Doji. The bulls and bears are playing tug of war.
The leading indicators, RSI and Stochastics are recommending a bullish bias of investors and the EMA is also bullish for smaller timeframes. I can see a strong support at $1.0850 and a near-term resistance at 1.0950. The breakage of $1.0850 is likely to lead prices towards $1.07300.
Forex Trading Signal
As reported in our previous week's analysis report, the prices have moved as per our predictions. So I'm staying in sell positions below $1.0920 with a stop loss above $1.1000 and take profit at $1.0850.
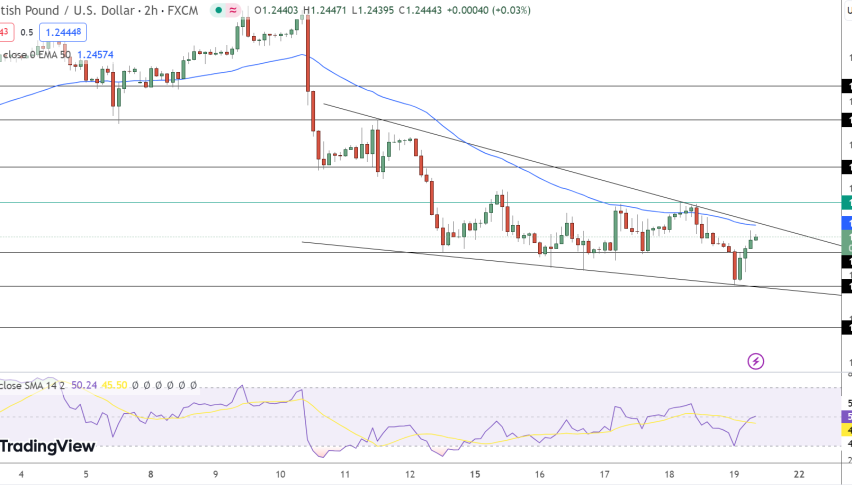
GBP/USD – Three White Soldiers Pattern
At last, the pair made it's way to the upside and came out of a well-maintained trading range of $1.2750 – $1.2850. The bullish movement in the GBP/USD was surprising as the GDP figures came out lower than expected. The actual GDP for the Q1 remained 0.3%, which was lower than the previous figure of 0.7% in Q4. However, economists were expecting a gain of 0.4% for the first quarter 2017.
The pair managed to continue the bullish momentum. Perhaps, it's due to the call for early elections by British Prime Minister Theresa May. Her victory in the elections will strengthen her position before Brexit negotiations.

GBPUSD – Weekly Chart
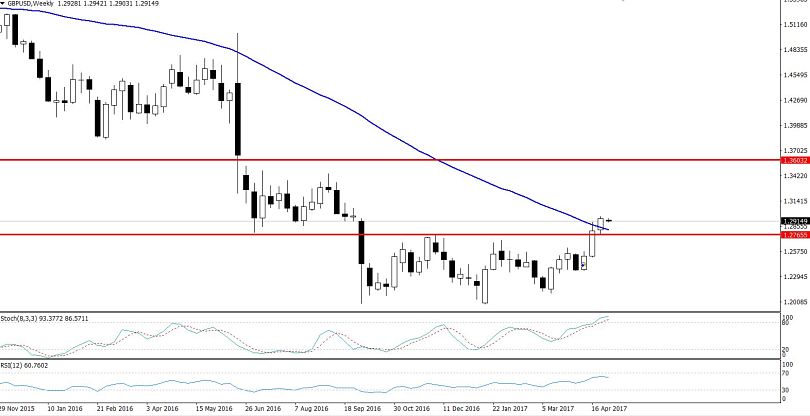
Technical Analysis – Weekly
The GBP/USD has been trading strongly bullish for 3 weeks. We can see in the weekly timeframe, that the GBP/USD has broken above a double top resistance level of $1.2815 which is likely to lead the prices towards $1.3200 in a couple of weeks.
In addition, while looking at the weekly chart, I figured out that the pair has also formed a bullish candlestick pattern named "Three White Soldiers". The pattern pre-indicates a strong buying sentiment on the part of investors.
Lastly, the 50 periods exponential moving average is also signaling a bullish bias of the pair along with the RSI, which is held in the buying territory of 50-70. Talking about the support and resistance, the pair is likely to find an immediate resistance at $1.31101, however, the breakage of this level is likely to open further room for buying up to $1.3350. On the lower side, $1.2845 and $1.2765 are working as strong support levels.
Forex Trading Signal
Considering the technical's, the trend is bullish for the moment. I would recommend to remain in a buying position only above $1.2850 with the stop loss below $1.2800 and take profits around $1.3100.
USD/CAD – The Commodity Currency
The Loonie seems to be in deep trouble due to the growing political concerns over U.S. protectionism. Protectionism refers to the practice which any government follows to shield a country's domestic industries from international competition by imposing taxes on imports.
This week, the Canadain dollar is likely to stay under pressure as the NAFTA negotiations are in focus. Trump declared a tariff on Canadian lumber imports as their domestic dairy industry was getting hurt from these imports. The import duties will lower the profit margins of Canadain companies, ultimately knocking the Loonie lower.
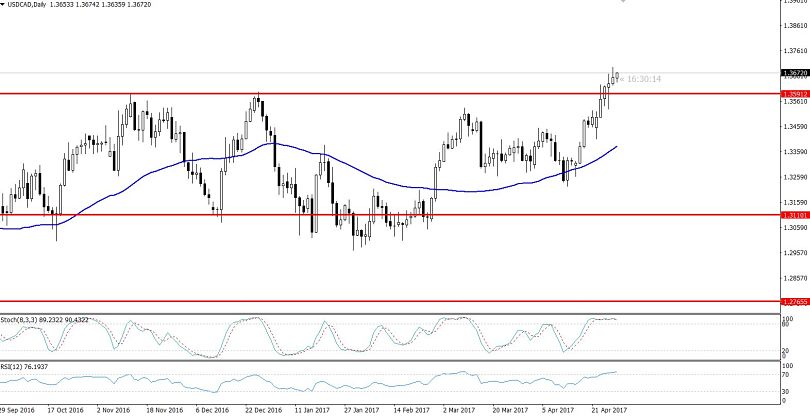
USD/CAD – Weekly Chart
Technical Outlook- Weekly
In the daily chart, we can see that the pair has already made its move upward, breaking a double top resistance level of $1.3600. No doubt, the bullish movement in the pair was triggered by the Canadian economy's unfavorable fundamentals but now the technical side is also supporting the bullish bias in the pair.
The USD/CAD is likely to find support at $1.3580. Investors will start buying once the prices retrace to this level. The RSI has entered an overbought territory above 70, which is signaling that retracement in the pair is imminent.
The bullish momentum is also supported by the bullish engulfing candles in the weekly timeframe. Perhaps, this week's closing will give us three white soldiers, which demonstrate a strong buying sentiment of investors.
Forex Trading Signal
I'm looking to stay on a buying side only above $1.3590 with a stop loss below $1.3490 and a take profit at $1.3750.
Conclusion
Traders, this week is very important from a trading point of view, as we have several high impact macroeconomic events on the table. In particular, the Fed fund rate, FOMC conference, U.S labor market figures, including Non-farm payroll and unemployment rate are likely to remain in focus throughout the week. The final round of French elections will be worth monitoring as they may cause gaps next Monday. Good Luck!