
WTI Crude Oil Price Forecast for 2021: Will the Uptrend End at $ 50?


Last Update: August 25th, 2021
Crude oil had an extraordinary ride in 2020, turning bearish in Q1, due to the coronavirus, with US WTI Oil crashing to $ -40 by April, for a number of reasons which we will explain in this article. The OPEC+ production cut by 7.7 million barrels in December 2019 didn’t help the situation for oil buyers. In our previous analysis in September, we left oil in consolidation at around $ 40, after an impressive reversal from April until September. The bullish trend in crude oil resumed in November, despite the new coronavirus restrictions in Europe and North America. Oil remains quite bullish as of late December 2020. This comes at a time when the economies in Europe and other countries, like Canada and Australia, are heading down again, which points to further gains ahead in 2021, if the coronavirus situation normalizes and the West gets back to normal.
Recent Changes in the WTI Crude Oil Price
| Period | Change ($) | Change % |
| 6 Months | +3.47 | +7.7% |
| 1 Year | 10.27 | 27.1% |
| 3 Years | -13.46 | -21.8% |
| 5 Years | +10.56 | +27.8% |
| Since 200 | +20.95 | +74.8% |
OPEC delivered one of the biggest cuts at the end of 2019 which pleased the Saudi Energy Minister, Prince Abdulaziz bin Salman Al Saud, as if they predicted what was to come in 2020. Last year was quite horrible for the fundamentals across the globe, particularly in the first two quarters, due to the coronavirus, but oil recovered after the crash. The demand increased as the global economy came out of recession in summer. While the west is going through another period of increased COVID-19 measures, the Chinese economy is still expanding at a great speed, which is keeping the demand for oil high.
The rising demand has increased the pressure on OPEC+ to commence the reversal of production cuts that were announced last year, which are being lifted slowly. However, this remains a battle between the impact of the coronavirus and the will to get back to normal, as is the case with most commodities. But judging by the unrelenting bullish momentum since April, we favor the upside for a while longer, especially as the world leaves the coronavirus behind next year.
Crude Oil – Forecast Summary
| WTI OIL Forecast: H2 2021 | WTI OIL Forecast: 1 Year | WTI OIL Forecast: 3 Years |
| Price: $ 55 – $ 60 Price drivers: The end of COVID-19?, China’s Economic expansion, Less dovish central banks | Price: $ 60- $ 65 Price drivers: Post COVID-19 recovery, Higher inflation, US politics, US Dollar | Price: $ 40 – $ 50 Price drivers: International politics, Global economy, Clean energy adoption |
WTI Crude Oil Live Chart
WTI Crude Oil Price Prediction for the Next 5 Years
The coronavirus was a major element in the price action of oil in 2020, especially in the first two quarters. The global economy and the market sentiment, which was driven by the COVID-19 pandemic, particularly in Q2, sent WTI Crude Futures Contracts down below $ 0 for the first time in history, on April 20. The coronavirus is still around, but the sentiment has improved for oil. The US Dollar was another contributor to the gains in oil during 2020, although the decline in the USD may have run its course and we might see a reversal in 2021. But, the demand for oil is high in China, which has turned the forecast for crude oil positive for 2021. However, with the alternative biofuels and the shift towards electric cars and clean energy, the long-term fundamental analysis doesn’t seem so bright for oil.
Is OPEC Going to be Persuaded to Increase Production Further, by Non-OPEC Producers?
Due to the decline in crude oil prices in 2019, the OPEC+ cartel of 23 oil-producing nations, headed by Saudi Arabia on the OPEC side and Russia for non-OPEC countries, delivered a 9.6 million barrel/day cut in oil output. But, since oil revenues are the main source of income for most of these countries, and because crude oil reversed higher after the crash of April 2020, they decided to relax the production cuts to 7.7 million barrels from the beginning of August, which added almost 2 million barrels to the daily production quotas. That didn’t have much of an impact on the crude oil prices, which was a positive sign, since the price of oil is expected to fall when production increases.
Since the market took that increase in production quite well, and the prices continue to increase above the August highs, the OPEC+ members are itching for more relaxation in the quotas imposed by the agreement. In December 2020, OPEC+ narrowly avoided the failure of its meetings, which went on for days, since there were numerous disagreements over how Russian-led non-OPEC partners and OPEC would act next year, considering that the coronavirus is still depressing the demand for petrol fuel almost everywhere around the globe, apart from China. A number of members of the non-OPEC alliance, including Russia, wanted the oil output quotas to be increased again, starting from January, but Saudi Arabia had intentions of keeping the status quo.
Eventually, they decided to increase production quotas by 500 million in total, as Mohammad Sanusi Barkindo announced, which is a long way away from the 2 million barrels per day that Russia intended to reach. That would bring the cuts down to 7.7 million barrels/day. However, it is not over yet, as Russia is expected to require another production increase by 500 million. So, the quotas will continue to be relaxed as the world economy recovers in 2020, but for now, oil buyers are ignoring that, with prices increasing towards $ 50.
Global Economy in the Crossroads Due to COVID-19
The Chinese economy went through a recession in Q1 of this year, after the coronavirus broke out at some point in late 2019, but the major effects in the economy came in early 2020. The virus spread in Europe a couple of months later, and the global economy went through a deeper recession in Q2. Services, in particular, took a massive dive, falling into the deepest recession ever, since they were all forced to close, apart from the essential businesses. Travel was also mostly suspended, both domestically and internationally, which is a big factor for oil prices.
The oil dispute between Saudi Arabia and Russia, regarding production quotas, sent US WTI Crude Oil plunging to $ -40 by April, but then oil reversed back up, and fuelled by the economic bounce in summer, it has been bullish since. But the European, Canadian and Australian economies slowed again in spring, and the cool-off picked up pace at the end of 2020, as the coronavirus restrictions increased, which saw some sectors, like services, falling into contraction again. International travel is still very minimal as well, so the demand for oil is not exactly surging.
On the other hand, we might be heading towards the beginning of the end with the coronavirus, which would improve the sentiment in financial markets, benefiting risk commodities such as oil and gas. The global economy would start getting back to normal as well, which would help increase the demand. China is already back on track, with the economic expansion picking up pace. The increasing demand from China has also been a strong factor in the bullish run in crude oil. So, we are at a crossroads regarding the global economy; at the moment it’s slowing down, but it might turn around very quickly if the coronavirus restrictions ease. Crude oil is also at an important zone, around $ 50, as it tries to decide which direction to take.
Oil/USD Correlation – Bearish USD has Helped Crude Oil
At some point in April, it seemed like US WTI Oil was over, as it fell to $ -40, but the bullish run since been has been impressive, and besides the reasons for the bullish momentum, which we explained above, the decline in the US Dollar has helped oil prices move higher, as most other assets that trade in the USD. After the initial jump in late February, the USD turned bearish and has been declining since then, which is not that reasonable, given that the US economy has been performing better than all other major economies apart from China. But I assume the political and social changes there are weighing on the buck.
For the USD, the decline stalled in September and October, which was also reflected in the oil prices, which consolidated in a range between $ 43.50 and $ 36 during those two months. That lasted until the US presidential election day in early November, when the decline resumed again, with oil turning bullish, picking up pace as the decline in the USD escalated.
The FED cut interest rates three times in March 2020, and it also loosened its monetary policy, while, like most countries, the US government introduced a coronavirus relief package. So, there have been plenty of US Dollars coursing through the markets, and the US Congress announced another stimulus package worth $ 2.3 billion. Although, at such times, this kind of stimulus package has had a positive impact on the currency, with the goal of getting the economy back on track.
Technical Analysis – Can Double Top Pattern Push Oil Below 77.75?
Looking at the monthly crude oil chart, crude oil is trading with a strong bullish bias at $67 and support at the $62.35 level. On the higher side, US oil is facing double top resistance at $77.75 and oil has closed with a doji candle just below this level. Typically, the doji candle demonstrates indecision among investors. However, when it’s followed by a strong bullish trend, we can expect a bearish correction.
That’s exactly what’s going on with crude oil. The overbought crude oil is heading lower to test the support level of 62.35 level and a break out of this level has the potential to drive further selling until the 55.10 support level. This support level is extended by a 50 period EMA line. The odds of a bullish reversal will be strong above 50 EMA. However, if it crosses below this, the next support will prevail around 47.70.
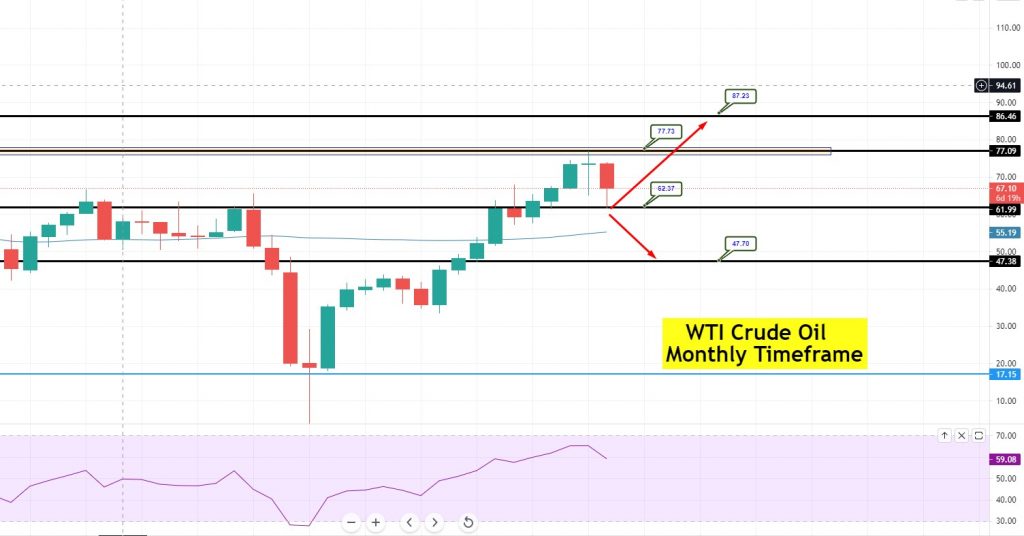
WTI Crude Oil Monthly Chart – Double Top Resistance at $77.75
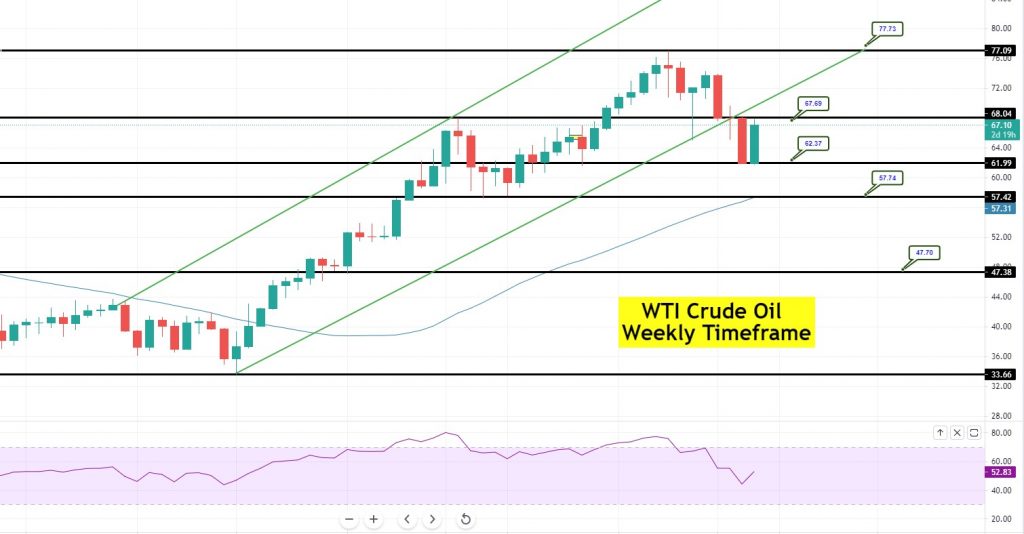
On the weekly chart, US oil is gaining immediate support at the 62.37 level. However, the formation of bearish engulfing candles below the 77.75 resistance level supports the chances of a bearish trend continuation. On the lower side, support will prevail at 57 and 47.70 levels.
The RSI and MACD are in support of a selling trend as the RSI has crossed below 50. In contrast, the 50 EMA is supporting an upward trend in the market. Thus, let’s keep an eye on the 57 levels to stay bullish above and bearish below the same level today.
The 50 SMA is pushing Oil towards the 50 SMA
The US stimulus program that was passed by Congress at the end of December should be positive for all risk assets, and therefore for crude oil as well. But, it might also turn the USD bullish, especially if the US economy improves after the extra cash that is soon going to be circulating.
Updated: August 25, 2021
Previous Forecasts
About the author
Skerdian Meta Lead Analyst. Skerdian is a professional Forex trader and a market analyst. He has been actively engaged in market analysis for the past 11 years. Before becoming our head analyst, Skerdian served as a trader and market analyst in Saxo Bank's local branch, Aksioner. Skerdian specialized in experimenting with developing models and hands-on trading. Skerdian has a masters degree in finance and investment.


