
Polygon (MATIC) Price Prediction for 2021: Mini Crash or Healthy Pullback?


Last Update: November 12th, 2021

MATIC/USD – Forecast Summary
| MATIC Forecast: H2 2021 Price: $2.00 – $2.70 Price drivers: Bullish Overall Cryptocurrency Market, Technicals | MATIC Forecast: 1 Year Price: $3.00-$4.00 Price drivers: Increased Adoption and Utility, Cryptocurrency Market, Technicals | MATIC Forecast: 3 Years Price: $4.00 – $6.00 Price drivers: New Developments from MATIC, Crypto Market Sentiment |
Current Updates
After breaching our H2 2021 forecast target of $2.00, MATIC experienced quite a drop in price over the past three weeks. After reaching a high of $2.22 it fell to as low as $1.527 which is equivalent to almost a loss of 30% if you bought at the high. Given the sharp decline, most people would be asking, is this a mini crypto crash or just a healthy pullback?
When trying to understand price action, I would always recommend to first look at the longer timeframe to get a better macro perspective of where the price is in the overall structure. A shift from the daily timeframe to the weekly or monthly timeframe could present key insights.
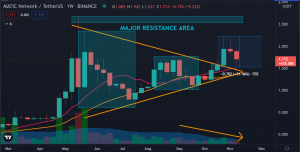
MATIC (Weekly): Shows a Healthy Retest of a prior Breakout Point
Indeed, the weekly timeframe clearly shows that the supposed “mini crypto crash” is simply a healthy pullback to a previous pivot breakout point. And when MATIC fell to the previous breakout levels of $1.50-$1.60, there was evidently immediate buying demand at those areas.
A “breakout retest” is a common occurrence in the markets and is considered a normal correction behavior as early buyers are keen to take profits, while those that were not able to participate in the initial breakout are beginning to buy at key support levels. However, this breakout retest can only be successful if it holds above the breakout level. At the time of writing, it would seem that it is still holding well above it. A big red flag if it falls back below $1.40 would negate MATIC’s breakout and long-term uptrend.
Polygon (MATIC) Past Price Analysis:
MATIC Network began its journey in the crypto field on 29 April 2019 with a value of $0.004. Afterward, MATIC started to rise steadily. The price hit the high of $0.03 by the end of May but dropped to $0.01 by early June amid certain variations. Later, it recovered some ground and continued to remain stable for $0.02 till the end of July. Once again, the MATIC token dropped to $0.01 by early August and resumed to be within the same price range with minor variations until November.
Finally, MATIC rose to $0.04 by early December quickly after gaining the market investors’ attention. Despite grabbing the investor’s attention, the value dropped to $0.01 by mid-December. At the end of 2019, MATIC was trading at $0.014. If talking about the 2020 year, it continued to trade at $0.014 during the dawn of January 2020. Afterward, the price started to variate and touched $0.02 by February. Suddenly, MATIC dropped to $0.006 by mid-March as the crypto market crashed due to the Covid-19 pandemic. Moreover, the price started to recover and restored its resistance level at $0.025 by the end of May. Then, the token hit $0.031 by mid-August and fell to $0.012 during November. At the end of December 2020, it was trading at $0.017.
In the year 2021, Polygon’s MATIC continued to trade at $0.0018 by early January 2021. Later, the price started to grow and hit $0.043 by the end of January. Then, MATIC surprisingly recorded an all-time high of $0.5089 on 12th March and recovered further. The token was seen performing well. But the upticks in the cryptocurrencies, including MATIC, were short-lived as the crypto market crashed on May 19th, which pushed most currencies into the bearish trend. MATIC was one among them where it dropped from $2.45 to $1.66. After this crash, most currencies recovered slowly, and that was when Polygon grasped the attention in the market.
In that way, the MATIC price hit a new juncture, from $0.94 to $2.1 on May 24, and showed the highest recovery rate among all cryptos, including monsters like Bitcoin and Ethereum. This was calculated to about 100% in just 24 hours when most currencies were floating after the heavy market crash. MATIC has maintained its bullish momentum and remained well bid, which is why traders believe Polygon has a great future.
As of now, Polygon’s token price is currently at $1.719. The current market cap ranking is #21, with a live market cap of $11,746,142,862. Polygon has a circulating supply of 6,872,890,164 MATIC coins and a max. supply of 10,000,000,000 MATIC coins.
With Bitcoin and Ethereum pulling back from all-time highs as well, so did most of the cryptocurrency market. MATIC was not spared as it has corrected -30% from 3-week highs.
Polygon Coin Introduction:
Polygon (MATIC) is the Ethereum powered token of the network. It was launched by Jaynti Kanani, Sandeep Nailwal, and Anurag Arjun. MATIC token is particularly used for building and staking user experience. When Ethereum became the blockchain giant, the movements with other blockchains dabbed. The blockchain monster proved to be an unstable team player with its scalability issues at its peak. Avoiding the major difficulties experienced, MATIC came out on top to build a multi-chain ecosystem of Ethereum compatible blockchains. Put simply; Polygon aims to find ways to create connections and interoperability between multiple blockchain networks, making the transfer of data and value straight.
It is worth mentioning that the Polygon network works on a Proof-of-Stake (PoS) consensus and possesses a sidechain of the mechanism and a group of validators. These validators promise to increase the TPS, thus also reducing transaction charges. The network works on a Plasma framework that exceptionally resolves scalability issues, preventing network congestion.
Recent Changes in the MATIC Price
| Period | Price | Change ($) | Change (%) |
| 30 Days | 1.241 | 0.478 | 39% |
| 6 Months | 1.724 | -0.005 | 0% |
| 1 Year | 0.016 | 1.703 | 10,644% |
| Since 2019 | 0.01400 | 1.70500 | 12,179% |
Polygon MATIC Price Prediction for 2021:
We have been doing our best to provide accurate price forecasts for a wide range of digital coins, including Polygon’s MATIC. We update our predictions daily with the help of historical data and using a combination of linear and polynomial regressions. Even after all these efforts, no one can predict the prices of cryptocurrencies with total certainty. So, it is important to understand that the MATIC price predictions, which we will provide, work only as a suggestion of possible price development and are not intended to be used as investment advice.
According to our forecast, the MATIC price may be seen trading at $2.00-2.70 by the end of this year. If more investors understand that Polygon not just supports regular payments but also smart contracts, then the prices of MATIC will experience a further rise. Thus, MATIC can see a high of $2.70 as the year closes. However, MATIC might drop to as low as $1.00 if it fails to reach the users since its movement is seen in a highly competitive space.
MATIC Price Prediction For 2022:
If the MATIC price hits the positive highs by the year-end of 2021, the 2022 trade might start bullish. In that way, the initial price for the coming year might be near $2.70. Conversely, if MATIC closes this year on lows, the next year (2022) might start being bearish. Thus, it may resume trading at $1.00 by 2022.
Some people believe that the Polygon price is associable with that of Ethereum. And considering Ethereum’s experts, MATIC could hit a high of $3.00 as of 2022 end. In contrast to this, the token might sink to $0.915 if the currency comes across supply pressure. But by the end of 2022, the Polygon may trade at $1.787 with regular market pressures.
MATIC Live Price and Chart
Polygon Price Prediction For Next 5 Years:
MATIC could hit a new high by breaking its previous price records in the coming 5 years, and it is expected to be in the top 10 cryptocurrencies list. However, the reason behind its growth could be attributed to its various inbound developments and partnerships. If the network can further work on TPS, that might eventually help ETH holders and cause the price to rise to $8.941.
However, the MATIC token may face a crash if sellers pull the prices down due to a possible market crash or any external controversies against Ethereum. This might result in a decline in the price, to $6.511. By the end of five years, MATIC could be seen trading at $7.241 with its improved scalability and layer-2 blockchain’s long-term success.
Monero Coin (XMR) Forecast for 2021: Will the XMR/USD Continue to Rise in 2021?
Ethereum (ETH) Price Prediction For 2021: Will Buyers Break 2017 Highs Soon?
Technical Analysis – MATIC/USD
MATIC/USD – Daily Time-frame
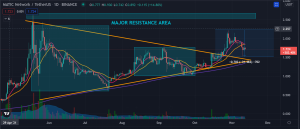
*MATIC/USD: Exhibiting a Volatility Contraction pattern – could explode soon!
MATIC has created a bullish double-bottom base consolidation, since falling from all-time highs in May 2021. This signals a change from a bearish sentiment to a bullish one, for the cryptocurrency.
MATIC’s price never fell below the major long-term 200-day moving average (purple line), unlike most of the altcoins, which experienced deeper corrections below the said moving average. This long-term moving average is a gauge used by most technical analysts, to determine the strength of a particular financial instrument. In the case of MATIC, it showed better relative strength than other cryptos including Bitcoin (BTC).
The fact that MATIC held up above this MA could be interpreted as investors, both retail and institutional, indeed believing in the coin so much so that they bought every possible dip in its price structure. Bullish sentiment built up every contraction, from peak to trough, with each showing decreasing volatility and trade volume – a sign that sellers may have stopped selling, and buyers slowly coming into the market.
Here are other reasons why MATIC’s bulls are back:
- Bullish Macro Perspective. The overall cryptocurrency market is a rally as of late with Bitcoin and Ethereum leading the way. Capital or money flow will trickle down to altcoins such as MATIC when major cryptos are already extended
- Double-Bottom. Bullish reversal pattern signifying a change in bias from bearish to bullish, as we saw in the crypto crash of May, through to the recovery in October
- Moving averages are aligned. Short-term, mid-term and long-term moving averages (MAs) are now in order. The 20-day (yellow) > 50-day (gray) > 100-day (green) > 200-day (purple): This can be interpreted as a build-up of bullish sentiment
- Tight Contractions. Each contraction from peak to trough is smaller than the previous one. The latest contraction looks very tight (1.60 to 1.40), similar to a momentum bull flag, but in this case, there is no momentum yet
- Breakout! MATIC successfully broke out of its downtrend line and even breached our year-end price target of $2.00. If you bought the breakout, you would have gained +40% if you were able to sell at the highs of $2.22.
Important Downsides to take note of:
- Breakout Retest. MATIC is now experiencing a retest to the previous breakout point. If price falls below this level, this could be a negative sign and a major red flag.
- MACD and ADX indicators are weak. MACD is in a downtrend after creating a crossdown. ADX shows a drastic slow down in momentum as well. Both indicators suggest a price consolidation in the near future for MATIC.
- Warning if it falls below $1.40. If the price falls below this level, this could mean further downside for MATIC as it negates the breakout trade entirely. This means there could be more pain and more selling in the near future.
Updated: November 12, 2021
About the author
Jose Maria Miguel Marquez is a Certified Securities Specialist of the Philippine Stock Exchange and is an equities and cryptocurrency momentum trader with almost a decade of experience. He specializes in technical analysis to trade the Asian, American, and cryptocurrency markets.


