Trading The Descending Triangle Pattern – WTI Crude Oil


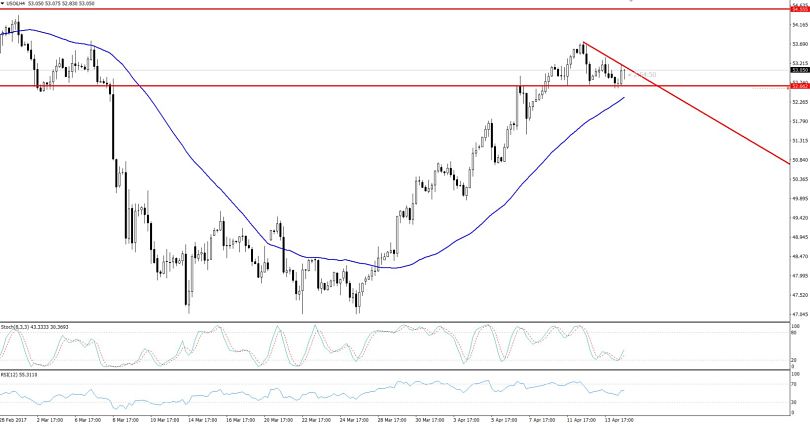
The WTI Crude Oil is trading sideways in a narrow trading range of $52.70 – $53.10 with no clear basis. However, it isn't at all surprising since we already knew that the market is unlikely to fluctuate in the absence of investors from several markets. Most of the markets are closed in the observance of Easter.
Aside from this, OPEC recently announced that its March production dropped by 153K barrels to 31.93 million barrels/ day. Considering the supply concerns investors are likely to increase the demand for a shorter period of time.
 WTI Crude Oil – 4 Hourly Chart
Technicals Outlook
If we look at an hourly chart, a descending triangle pattern catches our attention. The pattern is extending support to the crude oil at $52.65 along with a resistance at $53.15. All we need is to wait for a breakout. Yup, it seems unlikely today but we need to keep a close eye on it tomorrow in the early Asian sessions.
Talking about the leading indicators, the RSI is holding above 50's and the price is consolidating on the below and above the 50 periods EMA.
Forex Trading Signals
Considering the above points, I will be looking to add a buy position only above $53.22 with a stop loss below $52.85 and a take profit at $53.65. On the other hand, we can target $51.90 only if the market breaks below $52.65. Remember, we have EIA crude oil inventories figures being published tomorrow.