Gold Finds Support, Is It a Good Time to Go Long?


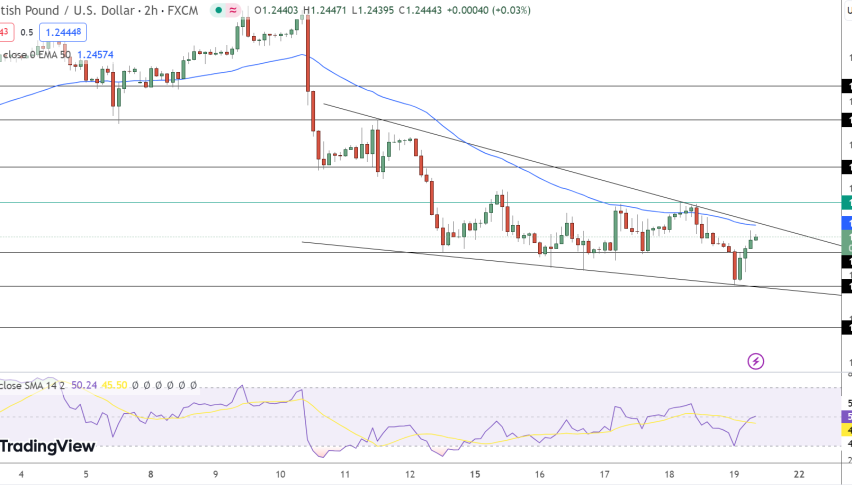
What's up traders, hope you enjoyed the another forex trading signal on GBPJPY and DAX (GER30) as both of these made +90 Pips and +100 pips respectively, however, Nikkei hit -40 pips. We didn't open Gold trade yesterday, but the trade setup seems very solid today.
Key Technical Drivers
I was seeing the Gold chart in order to figure the market structure and figured out a bullish Gartley pattern on the 4- hour chart. The Gold is forming a bullish Gartley pattern starting linking X ($1298) to A ($1357). The Gold is on its way to complete 61.8% Fibonacci retracement at $1321, the B point of Gartly.
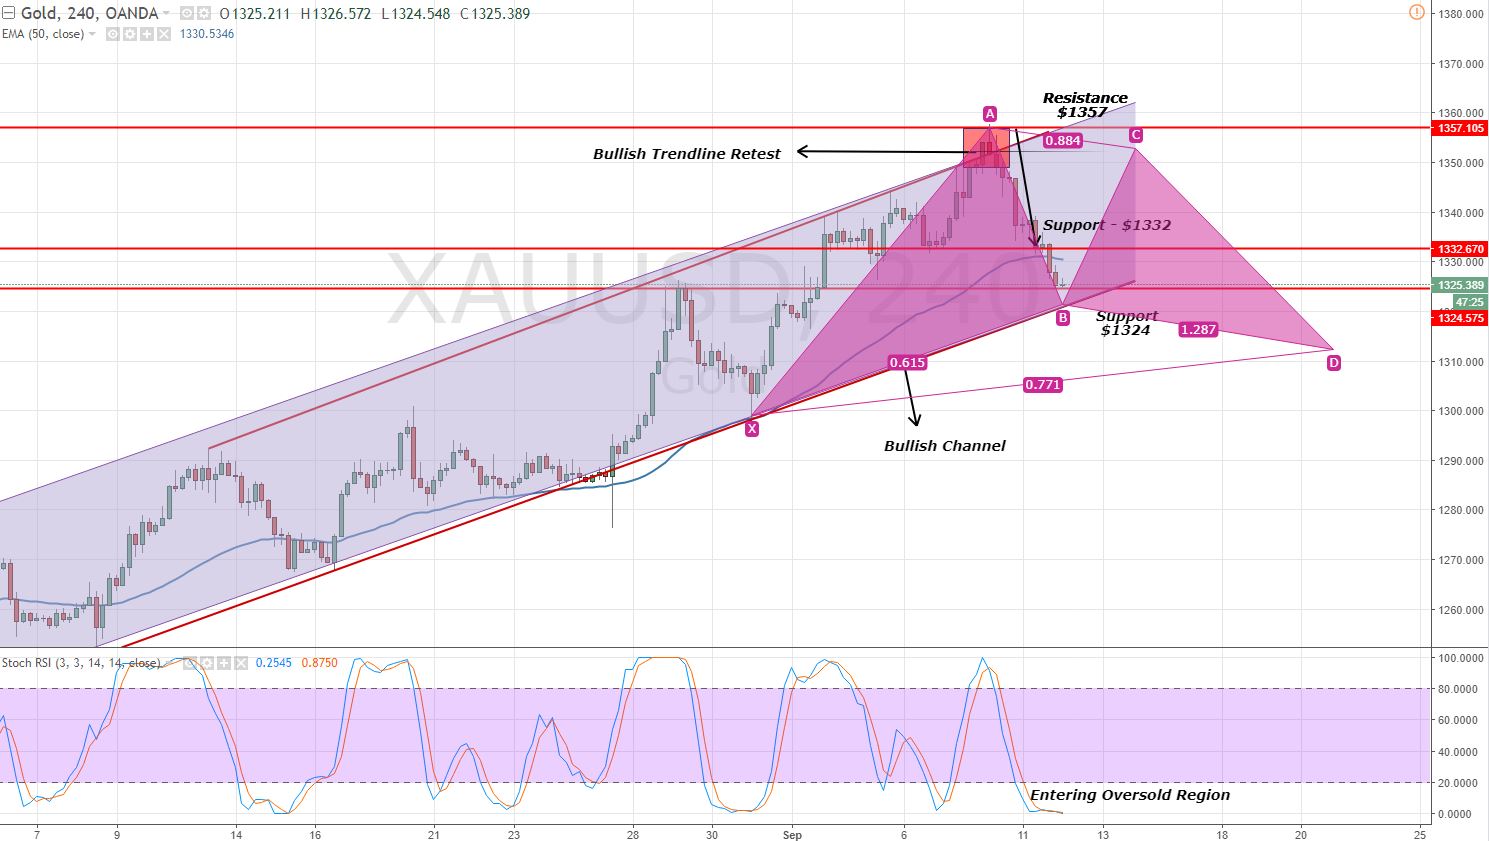
Gold – 4 Hour Chart – Gartley Pattern
Once the Gold completes 61.8% retracement at point B, it has a potential to go for point C at $1352. However, to make sure we aren't in the wrong setup, we can follow the FX Leaders Risk Management Strategies to limit our risk.
Interestingly, the bullish channel is supporting the yellow metal exactly at the same level of $1321. Yup, for us it's another signal to long on Gold. The Stochastic & RSI are below 20, signaling a potential of reversals in the metal.
Gold – Trading Idea
Today, I'm looking to buy Gold above $1321 with a stop below $1315 and a take profit at $1330, $1338 and $1343. Don't worry if the market goes against us, it's an opportunity worth taking the risk. Good luck fellows, wish you another profitable day.