
The Most Important Forex Indicators Every Trader Should Know
Forex indicators are at times a controversial subject. That’s really because everyone has their own perception of what is a good indicator and it can be a very personal thing.
Just as we have our own personal trading styles, it would stand to reason that we have our own personal indicators that would suit us best.
So finding the best forex indicators for your style should be based firstly on a few different factors.
Trending vs Mean-Reversion
The first thing you need to assess before you can even think about indicators is the type of market you’re trading. All markets aren’t equal and the most obvious example of this is the differences between forex, stocks and futures.
For the most part, stocks are mean-reverting. That means that when they have a big move on a particular day, they invariably revert-back in the direction of where they came from.
Futures, on the other hand, tend to trend. As they are based on big seasonal and fundamentals that are often playing out over weeks and months.
Then there is forex, which can often be a combination of both. Some pairs such as the [[USD/JPY]] might be more likely to hold a range, based on the fundamentals and the fact that it has safe-haven like properties. So there will be times when it is trending (in times of uncertainty), but overall it will remain relatively steady.
Whereas something like the [[AUD/USD]] which is sensitive to things like commodity prices, will often move in one direction and trend over multiple weeks or months.
So that will determine to some degree, what is the most effective technical indicator and how you should use it.
For example, trying to fade a strong trending forex pair using a Bollinger band strategy will likely now be successful. However, it might be highly effective for a more range-bound pair.
The Downside of Technical Indicators
While there are many benefits to using technicals to get a better gauge of price action, it needs to be noted that there is one glaring deficiency. That is the fact that technicals are a lagging indicator.
That means that we are seeing a representation of what has happened in the past. Of course, there is no way to predict the future with 100% certainty, so technical indicators need to be used with that in mind. They are simply a guide in the trader’s toolbox.
The Best Forex Indicators
Keeping what we have discussed in mind, we can now look at some of the best forex indicators for short-term traders.
Volume
Many traders overlook volume in forex trading as it is not a perfect measurement like in other asset classes such as stocks or bonds.
That’s because there is no one centralized exchange that can track all the volume that takes place and much of the volume being done in forex is OTC.
But as retail traders there is enough information for us to get an idea of what volume is doing.
The most effective way to use volume is around key levels. When a key support or resistance level breaks on increasing volume, that is telling us that there are larger players, such as big traders or institutions that are present.
That information is valuable to us because it tells us that there is more than likely going to be more volume coming in, in that same direction.
In this instance, we can use volume as more of a leading indicator in the hopes that price will follow through in the same direction it has been trading.
If the price tries to test a support level and can’t break through and volume is lower than we previously saw, that would suggest the opposite and that that level will likely hold. We can see that in the following example below, where price couldn’t break the key support level.
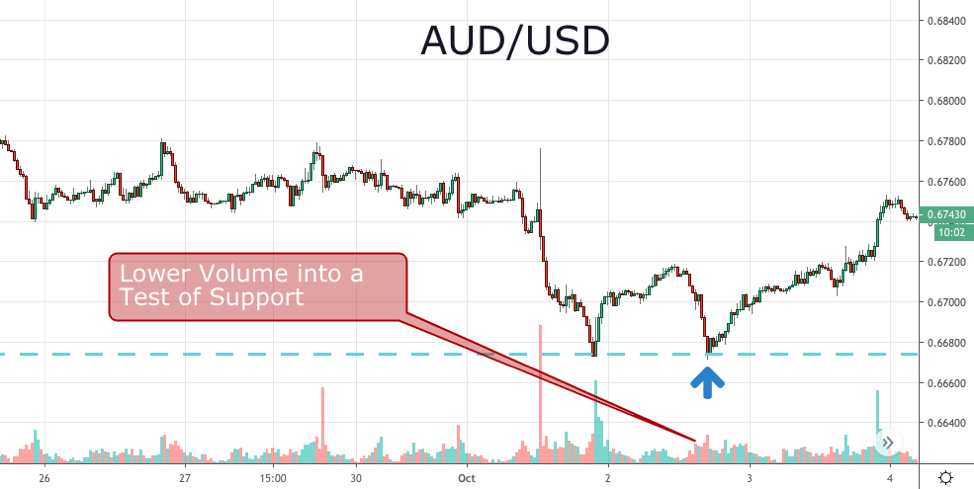
AUD/USD – 30min.
Moving Averages
Moving averages might just be the most common and popular indicator of all and are used almost universally by traders.
There are two ways we can use moving averages as a forex indicator, depending on your time-frames.
The most obvious is as an area of support and resistance. The price will often times bounce off the key round number moving averages, such a 20, 50, 100 or 200.
Of course, that number is applied to whatever time frame you are looking at. As such, we can get greatly varied results.
In my opinion, this is a strategy best applied to a strongly trending market. You can also increase the effectiveness by applying some basic candlestick patterns to it.
There is also a school of thought that by themselves, moving averages are not enough to make buy and sell decisions off alone.
The second way we can use moving averages as a forex indicator is as a sentiment filter.
What this effectively means is that we can use the position of the current price, relative to a longer-term moving average to gauge who is in control. The bulls or the bears.
That gives us an idea of the direction of the trend over the longer-term and as we know in trading, it is always best to trade in the direction of the trend.
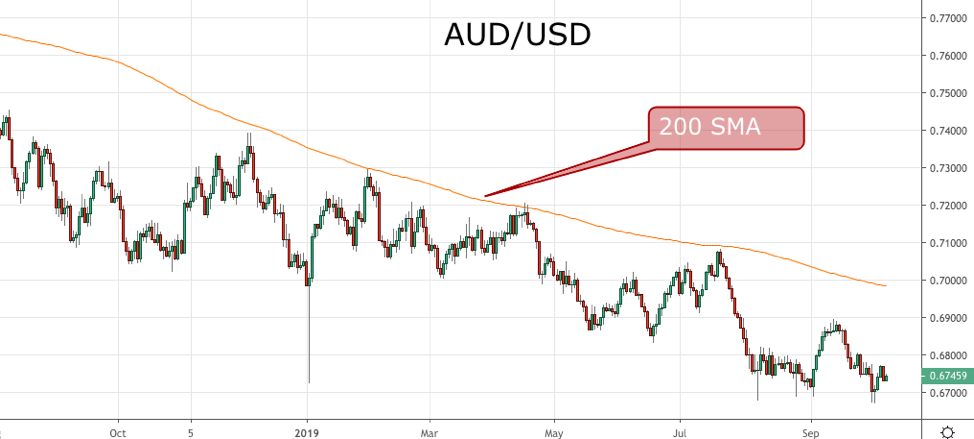
So for example, if price is trading below the 200-SMA on a daily chart, that is a good indication that you need to be looking for opportunities to the short-side.
AUD/USD – Daily.
Keltner Channels and Bollinger Bands
One of the most effective strategies in forex trading is to buy pullbacks in an up-trending market and short pullbacks in a down-trending market.
A very useful tool to identify areas to buy or sell, based on that idea is to use either Keltner Channels or Bollinger bands.
While there are subtle differences in the two, both forex indicators, show how far price has moved from the mean, in terms of standard deviations.
As a rule of thumb, using 2-2.25 standards deviations from the 20-EMA will give you a good starting point to build a trading strategy around.
When price is trending and has tagged the upper or low bound of the Keltner Channel or Bollinger Band, then when it pulls back to a middle line – which is just a moving average, we have what is a good indicator that price will likely continue in that same direction.
As mentioned before, a moving average alone might not be enough to use a raw signal, but in this type of instance, we are effectively using multiple indicators in one to buy and sell pullbacks in trending markets.
Which as we know is a powerful strategy regardless of the timeframe or product we are trading.
AUD/USD – Daily
Best Forex Indicator – A Combination of Multiple Forex Indicators
As we can see, by combining all three of the aforementioned forex indicators, we can start to build a powerful trading strategy.
First, we need to identify markets that are trending. We can do that by looking at daily charts and identifying forex pairs that are above or below a 200-SMA.
If a forex pair is above multiple SMA’s such as the 50 and the 200, then we can assume the trend is stronger.
From that point, we can use Keltner Channels to look for areas, where price has tagged one of the outer bounds, then pulled back to the moving average.
Finally, we can add in breaks and tests of key support and resistance areas, where volume is increasing.
They will be areas where you can either add to your positions or even exit trades when a level might fail at low volume.
Ultimately, the right combination of forex indicators is one of personal preference. You need to find the indicators that fit your personality, style and timeframes that you like to trade.
About the author
Rowan Crosby is a professional futures trader from Sydney, Australia. Rowan has extensive experience trading commodities, bonds and equity futures in the Asian, European and US markets. Rowan holds a Bachelor of Finance and Economics degree and is focused heavily on Investment Finance and Quantitative Analysis.


