

 <% (signals.list.current.rate).substr(0,7) %>
 <% signal.analyst %>

Last Updated: Jun 09, 2026 03:20:53 PM (GMT)
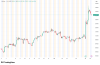
V: The current live price is 322.93, with a percentage change of +0.93%.
Support and Resistance Levels The pivot point is 320.67, with support levels at 318.95, 315.57, and 313.85, and resistance levels at 324.05, 325.77, and 329.15.
Indicators The RSI is at 62.73, indicating an upward trend. The ATR is 1.11258, showing volatility is increasing. The ADX at 14.49 suggests a weak trend. The current Parabolic SAR is at 324.12, showing no reversal. The price is above the 50-day SMA of 320.296 and the 200-day EMA of 321.8118, reinforcing a bullish outlook.
Market Sentiment With the price above the pivot point (320.67) and supportive indicators, a bullish trend seems likely.
V Signals & Technical Analysis
Market Sentiment
Trend Indicators
Oscillators
Moving Averages
Pivot
About (v) Visa Inc.
Company Background
Visa Inc. (NYSE: V) is a global leader in digital payments, facilitating transactions through its innovative technology platform. Founded in 1958, Visa has grown from a simple card program to a comprehensive payment network that connects consumers, businesses, banks, and governments worldwide. Headquartered in Foster City, California, Visa operates in over 200 countries and territories, processing billions of transactions each year. The company's mission is to empower individuals, businesses, and economies by providing tools and technology to enable seamless transactions and financial inclusion.
Market Position
As one of the largest payment processing companies in the world, Visa holds a significant share of the global payments market, competing with major players like Mastercard and American Express. In addition to its strong brand recognition, Visa benefits from its extensive network of financial institutions, merchants, and consumers. The company's strategic focus on technological innovation, such as contactless payments, digital wallets, and fraud prevention solutions, positions it favorably in the increasingly competitive digital finance landscape. With a commitment to expanding into emerging markets and enhancing its service offerings, Visa is well-positioned to capitalize on the growing demand for cashless transactions.
Key Financial and Industry Highlights
Visa's robust financial performance underscores its market leadership, with total revenue reaching $24.1 billion in 2022, representing a year-over-year growth of 19%. The company's net income also saw an increase, amounting to $12.2 billion, showcasing its strong profitability and efficient cost management. Visa has maintained a solid dividend policy, returning value to shareholders while investing in technology and expansion initiatives. The company is also actively pursuing strategic partnerships and acquisitions to enhance its global footprint and service portfolio. As digital payments continue to gain traction, Visa's commitment to innovation and customer-centric solutions positions it to thrive in the evolving financial ecosystem.
How to Buy or Trade Visa Inc. Stock (V) with AvaTrade
Trading or investing in Visa Inc. stock through AvaTrade starts with opening a verified trading account. After registration, complete the KYC verification process by submitting your ID and proof of address, then fund your account using a supported payment method such as bank transfer, debit card, or e-wallet. Once your funds reflect, log into the AvaTrade platform or mobile app and search for the ticker symbol V, which represents Visa Inc.. Before placing a trade, review the live Visa Inc. share price, market trend, spread, leverage options, and recent market news that could impact the stock price.
The next step is deciding whether you want to buy or sell Visa Inc. stock. Traders expecting the price to rise typically open a Buy position, while traders expecting weakness in the sector may open a Sell position using CFDs. Enter your preferred trade size, then apply risk management tools such as a stop-loss to limit downside exposure and a take-profit order to secure profits automatically. After confirming the trade, monitor key drivers including Visa Inc. earnings reports, product or service announcements, business segment performance, revenue growth, and overall stock market sentiment. Many traders also use technical indicators such as moving averages, RSI, and support/resistance levels available on the AvaTrade platform to improve timing and trading decisions.
Related Stocks


Sidebar rates
- <% signal.pair %>
<% signals.active.Current.rate.substr(0,7) %>
