The ECB Couldn’t Touch Our Profits – Weekly Analysis 7 – 13 March 2016
We've been long awaiting this week, as the European Central Bank members have been very vocal recently about further increasing the war on inflation. Thursday finally came and the ECB didn´t disappoint the market like in December. They actually exceeded our expectations, however, the Euro movements afterward were not logical. In fact, it surged about 400 pips after initially falling about 170 pips. We had a pretty good week, making 300 pips from 20 forex signals.
Did you think I was going to disappoint the market again this time?
Forex Signals
This week has been pretty good for us regarding the performance of our forex signals. The market has been volatile but we stuck to the less volatile pairs during most of the week and closed with a 300 pip profit. It would have been about 150 pips higher if we had opened a sell forex signal in NZD/USD. We considered opening a long-term sell forex signal in this pair when its price was at the 50 MA around 0.68, but then we decided to wait a little longer until the price reached the resistance level – which is about 100 pips higher at 0.69. But with a 300 pip profit, we can´t complain.
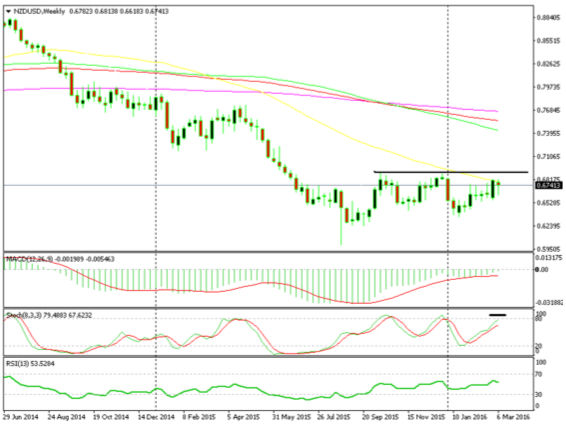
We missed the chance to sell NZD/USD at the 50 MA
We opened 20 forex signals this week – one of which remains open – and five of our signals were lost. This gives us a win/loss ratio of 75:25, which is the same as our long-term average. We started off well on Monday with two short-term winning signals, a manually closed EUR/USD long-term signal and a daily profit of 121 pips. On Tuesday, we had two winning signals and one losing one and closed the day with 10 pips. On Wednesday, we had a setback of 37 pips but more than recovered this loss on Thursday. Luckily, we closed the EUR/USD long-term sell signal for about 140 pips after the pair declined immediately following the rate cuts. We opened four NZD/USD forex signals, as this pair was banging its head against the 0.6680 resistance level. These closed in profit and we finished the day with a 262 pip profit. We got caught out by the 100 pips rally in the commodity currencies on Friday, but the last forex signal was successful and brought our balance to 300 pips for the week.
The market this week
The market has been waiting eagerly for this week to arrive since ECB president Draghi said that they would take further steps regarding the monetary easing at Thursday’s meeting. On Sunday, the Chinese officials had a meeting and they pleaded for growth at all costs. This, together with amazing US non-farm payroll numbers last Friday, eased worries of a global recession. On Monday, the price of Iron Ore surged 19%. That´s by far the biggest price deviation – and it happened in one day! Petrol benefited from the positive sentiment and closed the week above $38/barrel, sending the Canadian Dollar surging and the USD dipping below 1.32 against it. On Wednesday evening, the RBNZ made a surprise rate cut from 2.50% to 2.25% and sent the NZD plunging by about 150 pips.
But the biggest event this week was the ECB meeting on Thursday, as we mentioned above. A lot was promised in the last two months so if they had failed to deliver according to market expectations as they did in December, then the ECB would lose credibility. Thus, they had no choice and exceeded market expectations. They cut the deposit rate to -0.40% from -0.30 % and cut the main REFI rate to 0% from 0.05%. The monthly QE program assets increased to 80 billion Euros from 60 billion. This program started in April with a wider range and, for now, LTRO operations will start in June. That´s probably the biggest move by a central bank in a single meeting for as long as I remember. After shooting up 500 pips in December, one would expect that the Euro would sink now that they over-delivered. The Euro did fall for about 170 pips right after the announcement but then reversed and rallied for 400 pips. In recent times, particularly since the 2008 crisis, the currencies normally decline after the central banks ease the monetary policy… so the Euro should have declined as well. However, we’ve experienced a national currency rising after such action many times in the last decade. This looks like one of those times when the market thinks that the ECB measures will be positive for the economy of the Eurozone in the long-term and it boosts the inflation.
Economic data
On Monday, the monthly German factory orders declined by 0.1% but the decline was smaller than expected. On Tuesday morning, the final Japanese reading for Q4 2015 published at -0.3% and the current account was lower than expected while the Eurozone GDP numbers showed a 0.3% expansion. The British monthly manufacturing posted a nice 0.7% increase but the industrial production missed expectations. In the evening, the Royal Bank of New Zealand cut the interest rates by 0.25%. The US unemployment claims data showed another decline which puts this aspect of the economy in an even better place, but Thursday it was all about the ECB because they cut all the interest rates and increased the size of the QE program. On Friday, the Canadian unemployment rate increased by 0.1% but the CAD rallied because of the increase in petrol prices.
Pairs analysis
This week there was plenty of activity in EUR/USD and a lot of things have changed, so we should revisit it. The ECB fired all their guns on Thursday but the Euro had an opposite reaction to what was expected from such occasions. Instead of tumbling to 1.05 against the Buck, it closed the week at 1.1150 after initially sliding 170 pips. Technically, the 1.08 level has become an even stronger support since holding the price above twice this week. Even the weekly chart looks bullish and we are above the 20 MA in that timeframe, which is another bullish sign – but it is the fundamentals that have the final word.
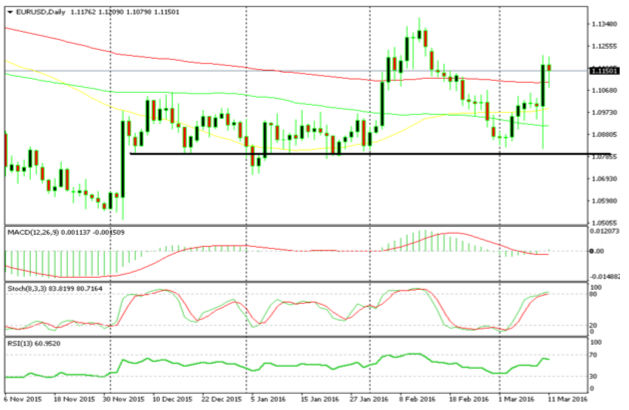
The 1.08 support level held twice this week
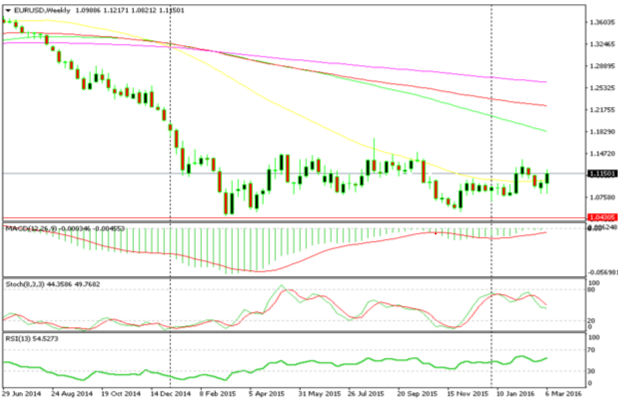
We are above the 50 MA which is another bullish sign
The decline in USD/CAD has extended further this week and the price got very close to the 50 MA, which stands at 1.3110, while the low for this week was 1.3165. The weekly chart looks oversold with all three indicators below, at, or close to the oversold area. However, there is more room to the downside in the monthly chart – maybe until 1.30 or 1.28 – which was a strong resistance level and then it turned into support after being broken in July last year. The 50 MA in the weekly chart is the first obstacle so we will observe it closely. If it lets go too easily than we will wait for the price to drop before getting in long.
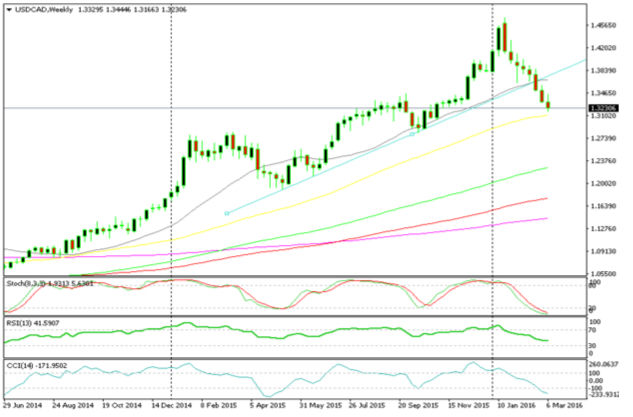
The 50 MA is the first obstacle towards the downside
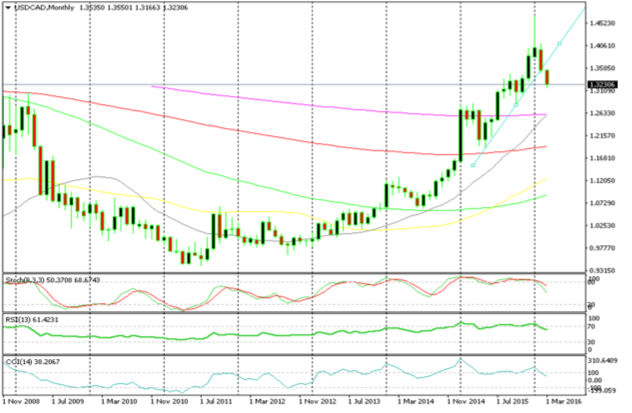
There´s some more space if the price decides to move further down
Week in Conclusion
Finally, the ECB made their decision. They cut the deposit and REFI rates, as well as increasing the monthly purchases and the range of the assets being purchased. The market somehow decided that this was positive for the Euro and it gained about 400 pips. But that’s in the past now and next week the market will shift its attention to the FED and their monetary policy. We will try to continue with the same performance as we did this week.
- Check out our forex signal articles here
- Check out our free forex signals
- Follow the top economic events on FX Leaders economic calendar
- Trade better, discover more Forex Trading Strategies
- Open a FREE Trading Account
- Read our latest reviews on: Avatrade, Exness, HFM and XM
Related Articles

Sidebar rates
Related Posts
