Central Bankers Are Back From Holidays – Weekly Analysis 5 – 11 September
Goodbye summer, hello autumn – in my opinion the best season! The hot days are behind us at last and the liquidity is cooled to normal as well. The forex market behaved in a more reasonable manner this week; what was supposed to go up went up at just the right time and what was supposed to go down followed suit.
This sort of price action made the market more trader friendly since the moves were easier to forecast. We used this opportunity to get back to our normal performance with good short-term forex signals after a period of relying mostly on long-term signals during the holiday season, due to low liquidity and irrational market behavior.
That strategy worked pretty well for us since we only lost two forex signals this week and won all the rest, thus finishing the week with a nice 90 pip profit. I´m still beating myself up for missing several good opportunities to open long-term signals, but are we allowed to complain when we end up in profit?
We´ll talk about all this in this September weekly review. But more importantly, we will take a deeper look at the unfolding of the FED interest rate debate, the ECB meeting, the ongoing Brexit process, and the recent economic data coming from US and UK.

Draghi is doomed to never be happy again
Forex Signals
This week was when most forex traders returned to their trading desks after saying farewell to their beach chairs and sand castles. Based on the history, we assumed the liquidity and the price action would return back to normal. But you never know how long it takes for a trader to settle in and feel the market after the holidays.
From my personal experience and what I have heard from fellow traders, it takes 1-2 weeks watching the market and staring at the forex charts to get comfortable and feel how the market moves. So, we decided to be flexible and adjust to the market; if the price action was to get back to normal then we would concentrate more on short-term forex signals if the volatility continued then we would keep using our long-term signal strategy.
As the week progressed, the forex traders got more and more engaged in trading and since the price action became more predictable we became focused on the short-term signals. It worked well for us and we closed the week with a 90 pip profit from our 10 forex signals. The win/loss ratio also benefits when the price action becomes more predictable, so thus the ratio for the week jumped to 80:20 since we only lost two signals, while the other eight were closed in profit. I can´t say that USD/JPY is the easiest forex pair to trade, but it became the star of the week for us with four straight winners.
We could have made a lot more this week if we pulled the trigger on several long-term forex signals. EUR/USD and GBP/USD offered some good opportunities to open a couple of long-term sell signals when they reached the top at 1.1320s and 1.3440s, respectively. But, the move up and the reverse in EUR//USD happened too quickly to allow us to make a rational decision and the recent fundamental indicators for the GBP surprised the market. In the end, we were afraid we might see a short squeeze higher in GBP/USD, so that´s why we hesitated.
Although the signal I´m beating myself up for not opening was the long USD/CAD trade. As you can see from the forex chart below, this forex pair reached the 200 moving average on the daily chart by midweek, which is where the trendline stood. Also, the stochastic indicator touched the oversold area just three days later – so the price is 200 pips higher.
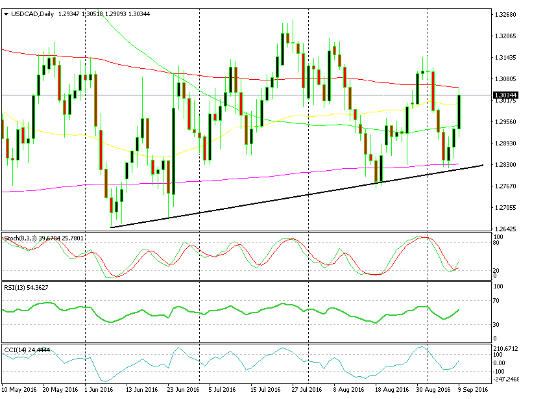
The trendline and the 200 moving average just can´t let go
So yes, we missed this great opportunity worth at least 200 pips, but we did tell you about it when the price was 200 pips lower. We posted a live market update on Wednesday morning where we explained the fundamental and technical reasons to buy this forex pair. That was a good trade idea that we laid out for you guys and it is about the same as a forex signal, except for the take profit and stop loss levels. After all, you are responsible for your actions; you might refuse a trade idea just like you can refuse a forex signal. Anyway, don´t worry if you missed that trade opportunity just like us, there will be many more opportunities in the coming days/weeks. But, we suggest that you follow our market updates for additional trading opportunities besides live forex signals.
The market this week
Besides the ongoing Brexit saga which will carry on for months and years to come, the forex market had two things in mind this week, the ECB meeting on Thursday and the FED meeting which is coming up in more than a week. Where do you want to start?
Let´s start with the ECB meeting since it actually happened this week, and while we still have plenty time to prepare for the FED. The market was expecting the ECB to either signal/hint or to announce additional monetary easing measures. But the ECB left everything as it was for the time being. For the first time, President Draghi decided to put on a smile and not be his moody self. Too bad the economic data from the Eurozone let him down the very next day.
The forex market took this as a bullish sign for the Euro, but quickly got back to its senses and started reading between the lines, and this revealed the real and usually dovish Draghi. It realized that more easing steps are coming soon and so the Euro started diving, to end the week with a bearish tone.
The picture on the other side of the ocean was even more ridiculous. The FED members kept contradicting each other with their numerous comments this week. In the first part of the week, we had FED members such as Lacker and George who brushed aside the recent soft US economic data, including last Friday´s employment report and this week´s non-manufacturing numbers.
Only a couple of days later, Rosengren, Kaplan, and Tarullo formed an alliance opposing the other FED members. These were more or less the pro and against comments regarding the economy and a September rate hike:
Pro –
-
“Over-stimulating the economy is a risk for inflation”,
-
“The case for hiking the rates in September is strong”,
-
“The new job creation cannot be in the 200k-250k forever”,
-
“US at near or full employment”
Against –
-
“Unsure whether the economic momentum is holding up”,
-
“The FED can afford to be patient”,
-
“Hard to see the FED hiking too soon (is September too soon?)”
Both sides make valid points, but don´t they ever consult each other before going berserk into the public? By the way, the super dovish member Brainard will hold a speech on Monday and some market analysts (me) are saying that she´s sent out by Yellen to cool off the expectations of a September rate hike, hyped by Yellen herself a couple of weeks ago.
Just one last thing, on Wednesday the BOE (Bank of England) chairman Carney said that the recession risks for the UK have receded because of BOE actions. The BOE took some aggressive measures in August but you don´t expect the monetary policy changes to have such an immediate effect. I would say it takes at least 6 months to one year to see the first effects and he's a strong supporter of the lagging effects of central banks´ actions, nevermind that he cried recession before the Brexit vote. Now, suddenly he reclaims all the credit for the pickup in the recent economic data.
Economic data
In the recent weeks, we have seen some deflection in the trend of the US and UK economic data. The US data in the last 3-4 months showed an improving economy, while after Brexit the UK economic data showed that the economy was in freefall. But in the recent 2-3 weeks, we have seen that the economic figures from the UK started to pick up incredibly fast while the US numbers showed that the US economy was losing steam pretty fast as well. That´s the reason the data from these two economies has grown in importance.
The UK manufacturing sectors continued to decline this week, but that sector only makes up for a small portion of the UK economy. The service sector, which is the holy grail of the economy, jumped from 47.4 points to 52.9 points. That´s the largest jump on record and is showing that right now that the economy if successfully facing Brexit.
In the US, the unemployment claims and the JOLTS jobs opening beat the expectations, showing that the employment is very strong. But the service (non-manufacturing) sector took a dive from 55.5 to 51.4 points. That´s awful and the US just can´t have that right now. Let´s see if this was only a one off.
Pair analysis
We had a short coverage of USD/CAD in our market updates, where we explained that it was a good opportunity to buy this pair when the price was hanging around the 1.2820-30 region. The 200 moving average and the ascending trendline were waiting there on the daily chart and on the weekly forex chart it was the 100 moving average, and this added strength to that level. The price tried twice to break below the 1.2820 level but failed and reversed back up without looking back. The stochastic indicator on the daily chart still has a long way to go before it reaches oversold levels, so the rally might extend to 1.33 if the momentum keeps going. On the monthly chart, the 200 moving average in gray is doing a good job in preventing the price to close below it at the end of the month. That´s another reason which goes in favor of the buyers.
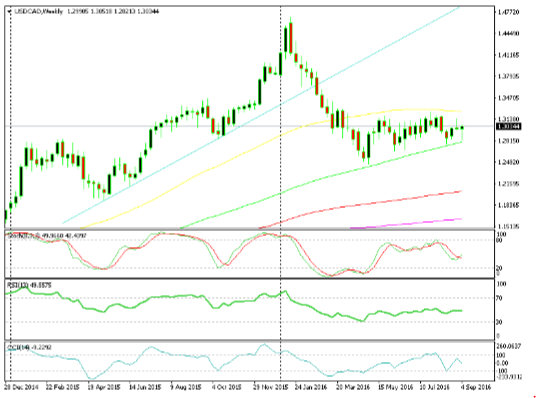
The 100 moving average is providing solid support
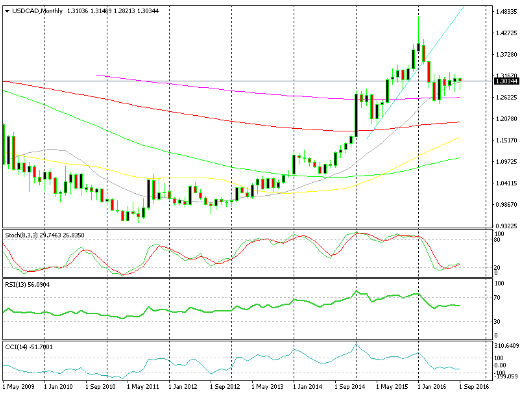
The price hasn´t closed below the 20 moving average in three months
Much like NZD/USD, AUD/USD has been in a downtrend for more than two years, as we can see from the weekly forex chart. This year it managed to make a comeback, but looks like the upside is running out of steam. There are two signals in the weekly chart which point down and these are resistance provided by the 100 moving average (in green) and the weekly candlestick which closed as an upside down pin. These are bearish signals. The monthly chart also paints a bearish picture since the 200 moving average, in pink, has been a concrete wall since early 2015. But for the downtrend to resume, the hunt for yield has to come to an end.
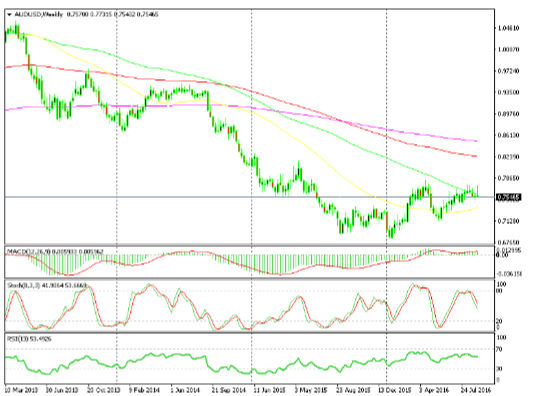
The 100 moving average keeps pushing the price down
.jpg)
The 200 smooth moving average has been a closed door so far
Week in Conclusion
The ECB was expected to provide us with some action in forex this week and they did, although they didn´t change or say anything which could affect the market. Yet, some whispers are saying that we will soon see some action from the ECB. Draghi will have a press conference on Tuesday next week, so will he announce it then or will he just hint at the market?
We were also dealt a soap opera from the FED members this week as well, with members opposing each others' comments. The disappointing economic data we have seen recently have driven them apart, which gives the retail sales and the inflation data next week extra importance. But first, let´s see what Brainard has to say on Monday.
- Check out our free forex signals
- Follow the top economic events on FX Leaders economic calendar
- Trade better, discover more Forex Trading Strategies
- Open a FREE Trading Account
- Read our latest reviews on: Avatrade, Exness, HFM and XM
Related Articles

Sidebar rates
Related Posts
