Commodity Currencies Pressured by the US Dollar – The Aussie and Canadian Dollar Decline Sharply
In Thursday’s article, I mentioned that I would have liked to see the AUD/USD trade below the 20-day exponential moving average again and that this would keep me excited about playing this pair on the short side. Today the pair closed convincingly below this exponential moving average, and I’m smiling because I’m still holding on to my short positions which I opened on the 22nd and 23rd of August. Let’s look at daily chart:
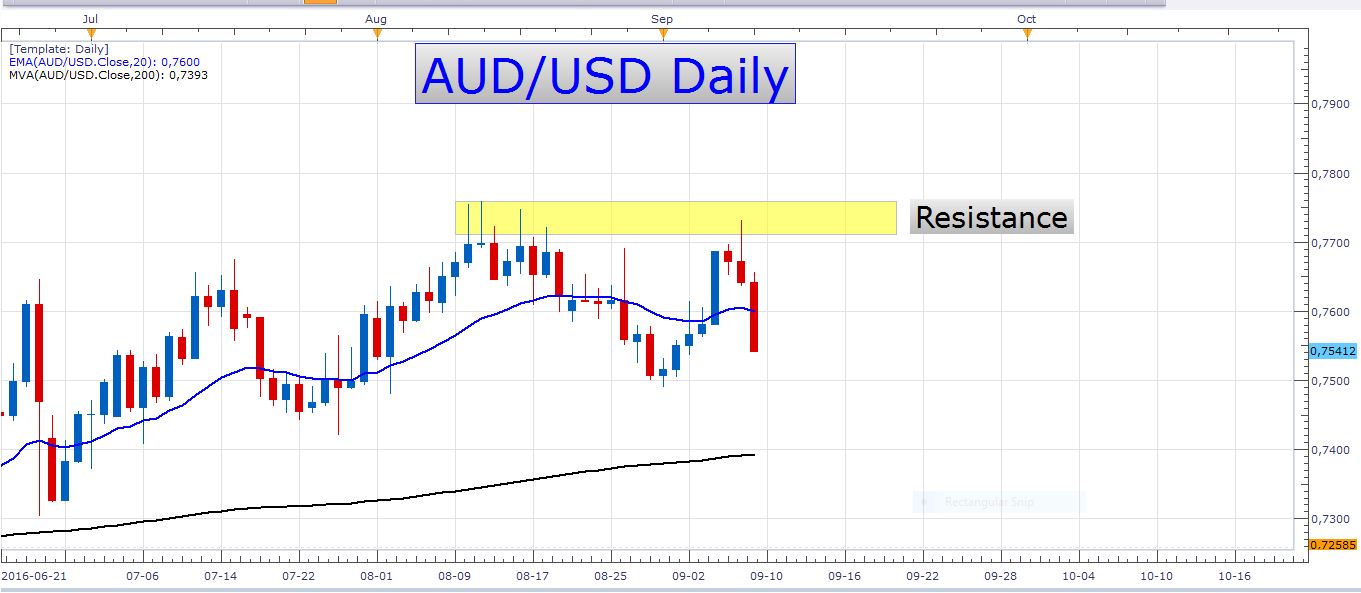 AUD/USD Daily Chart
If you’ve been trading this pair lately, you will know that the recent aggressive bounce was a real threat to bearish market players. This made me think that perhaps the idea to short this pair wasn’t such a good idea after all. Luckily the resistance zone (as marked on the chart above) has withstood the buying pressure, and the bears managed to defend this zone successfully. Friday’s bearish engulfing candle was a clear pointer to a further decline in the exchange rate today. As you can see on this chart, the bearish market participants remained in control until the end of the trading day. The daily candle basically closed on its low. This is called a shaved bar. This is a very encouraging picture for traders holding short positions. Let’s look at a 4-hour chart:
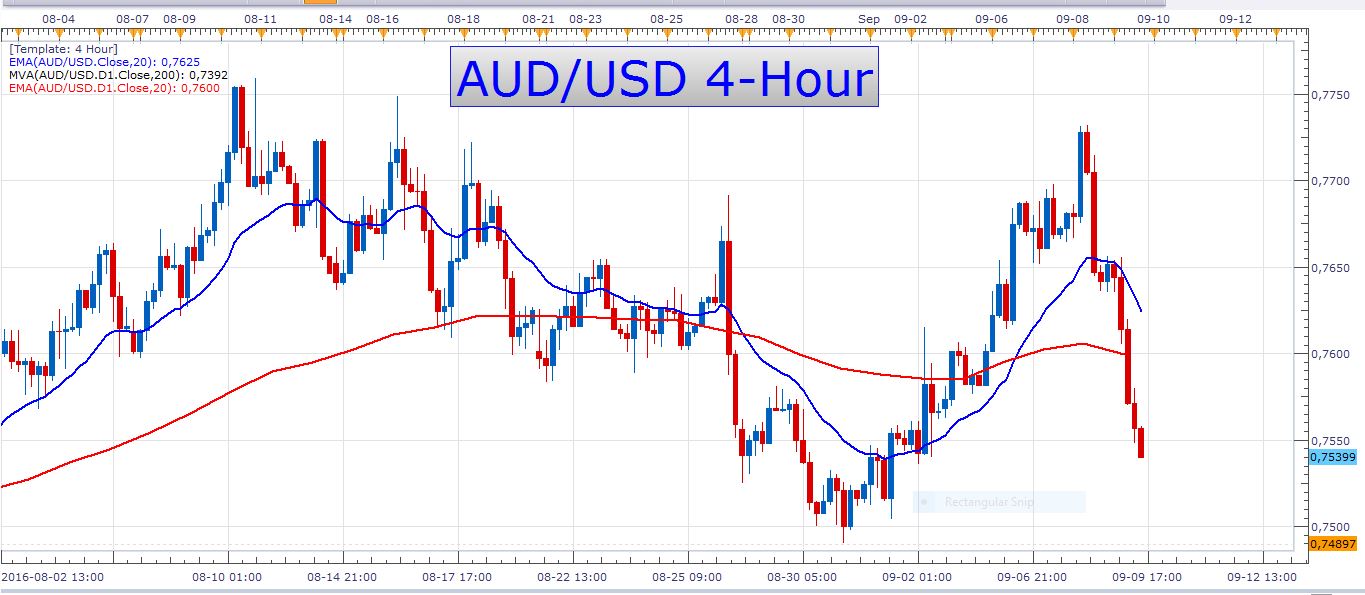
AUD/USD 4-Hour Chart
Here it is easy to see just how incredibly aggressive this recent decline was. Notice the sharp angle at which the pair descended, and the size of the red candles which compose this descent. Now despite the strength of this bearish move, I would not enter a short position at the current price level. I don’t like chasing the price. This is when you pay too much for what you get, or when you don’t get enough for what you are selling. Let me show you something very important about trading that you need to know. Let’s look at a 4-hour chart:
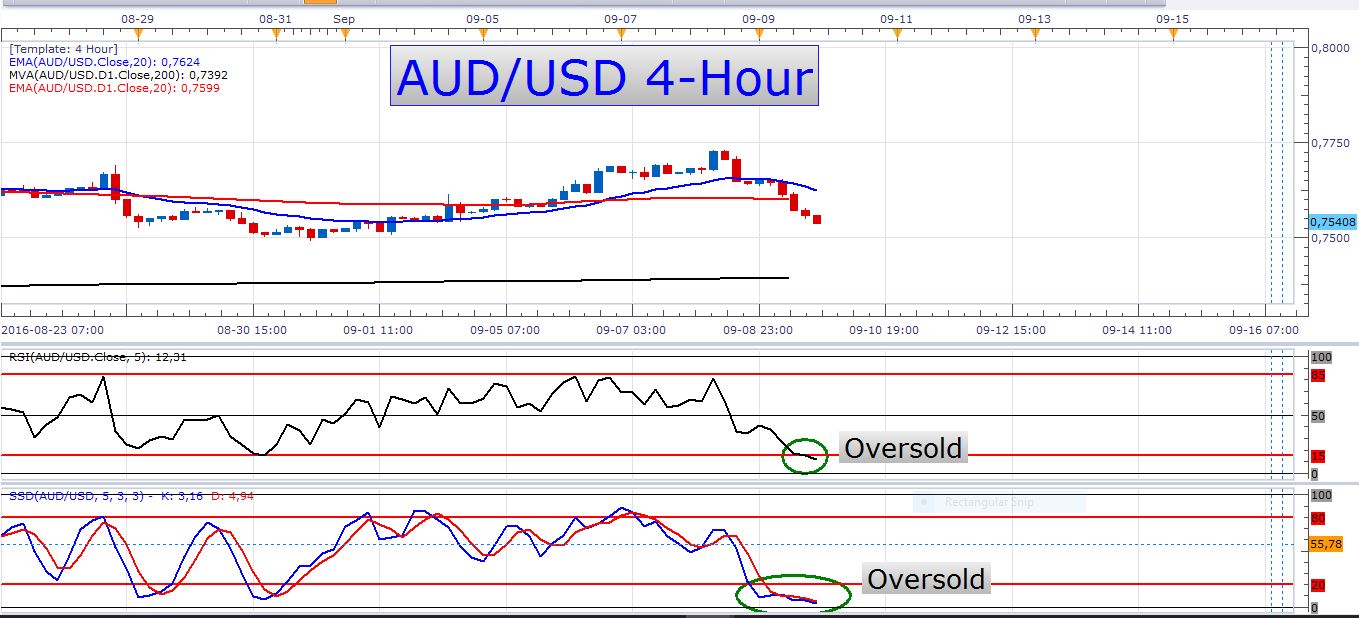
AUD/USD 4-Hour Chart
Here I’ve applied two indicators to the chart, namely RSI, and slow stochastics. These are both oscillators which indicate whether an asset is overbought or oversold. Here you can see that at the moment both of these oscillators display oversold readings. Now we know that a currency pair can remain in oversold or overbought territories for extended periods of time, but the probability of a correction stepping in when it’s at these extreme levels is very high. It’s difficult to show you this with a single screenshot, but if you open this chart on your platform and apply these indicators, you will see exactly what I’m talking about when you just look back at what happens every time the price finds itself in an overbought or oversold condition. You will often see a price retracement soon after the indicators give extreme readings. Of course, you will miss opportunities when you observe these indicators, but you will spare yourself a lot of losses if you wait for the price retracement to take place before you enter a trade. Trade on your terms, not on the market’s terms. Beginners like to sell when the price is oversold, and buy when it is overbought. They are afraid of losing out on the ‘big move’ and think that price will continue to trade in a straight line in the current market direction. So they enter the trade, and soon afterwards find themselves caught up in a losing trade when the correction steps in and pushes the price against their trade. More experienced traders, on the other hand, know that if they wait for retracements they can utilize, they achieve more precise entries, which means they can make more profits, and suffer less frustration.
Traders who are seeking short entries on the AUD/USD may wait for retracements to, for example, the 20 EMA on an hourly chart. This exponential moving average can also be used on many other timeframes which include the 4-hour, daily, and weekly charts.
GBP/USD
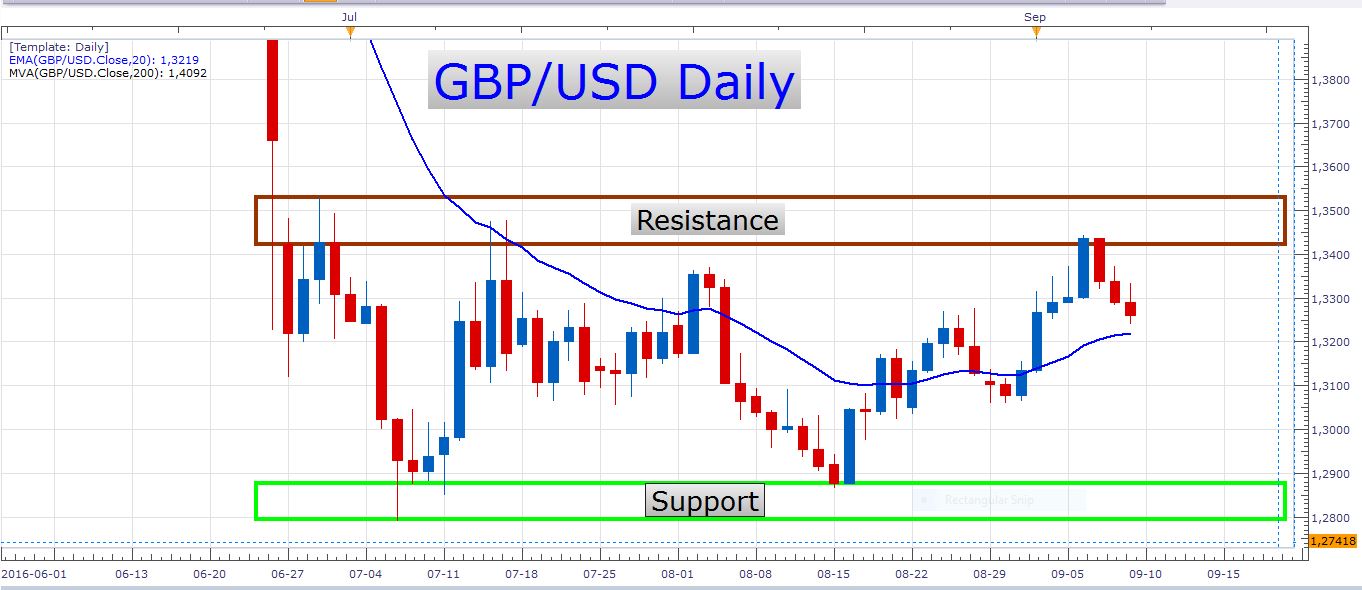
This pair is still trading between major support and resistance levels. It is difficult to join oneself to a certain directional bias at the moment. Nevertheless, I wonder if the market reaction to the Brexit event wasn’t a big overreaction and that the pound is somewhat undervalued at the moment. If this is the case, we could see the GBP/USD break out of this range soon to conquer some more upside. Look at this daily chart:
GBP/USD Daily Chart
Economic data
Tomorrow is a very light day in terms of economic data, there are no releases with any significant market moving potential. It is also a holiday in Singapore.
Profitable trading!
- Check out our free forex signals
- Follow the top economic events on FX Leaders economic calendar
- Trade better, discover more Forex Trading Strategies
- Open a FREE Trading Account
- Read our latest reviews on: Avatrade, Exness, HFM and XM
Related Articles


Sidebar rates
Related Posts
