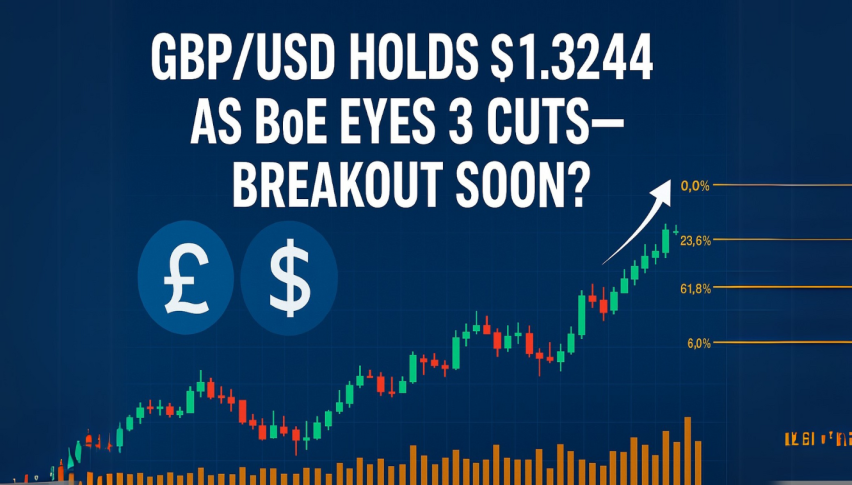
While The US Dollar Closed Lower On The Day, There is Underlying Strength in The Pound
Trend traders must have felt a lot of frustration these last few weeks. One day the dollar rises, the next day it falls again. All the major currency pairs have been trading sideways for the last couple of weeks, and we haven’t seen any significant levels been breached lately. This makes trading quite tricky and somewhat frustrating.
Although the GBP/USD has also been caught up in a range since the Brexit, this pair looks like it’s getting ready to break out higher. This could, of course, happen quickly, or take very long to happen. We could have a false breakout or a breakout followed by a retest of the breakout level, or no breakout at all. Predicting what will happen when is often very difficult. The well-prepared trader will be ready for anything, and will know what to do when either this or that happens.
A few weeks ago there were some rumors that institutional market players were loading up on some long pound exposure. Soon after that, we encountered some pretty impressive economic data out of the UK, and the pound’s advance just accelerated. Let’s look at a few charts:
GBP/USD Daily Chart
Last week the pair failed at an important resistance level. These five consecutive bullish days made it look like the pair would rip through this resistance zone like a hot knife through butter. This didn’t happen, though, but this doesn’t exclude the possibility of it happening sometime soon. What we should be prepared for, is that perhaps the pair will ram against this resistance until it eventually breaks.
If we look at the recent price action, it looks like we have a bottoming formation to work with here. Look at the following chart:
GBP/USD Daily Chart
Clearly, there was remarkable value to be found in the 1.28 to 1.29 price zone. It is here where the buyers quickly snatched up the available liquidity as they esteemed the price to be a bargain in this area. This is also an area that might be difficult for the sellers to overcome.
Now you might be thinking about how to trade this setup. This can be a tricky situation to take advantage of. Just remember that the pair might not necessarily break out higher at all. Let’s look at a daily chart again:

The idea is to wait for the price to break through the resistance level (horizontal black line). What I’d like to see is at least one daily candle closing firmly above this level. Then I’d wait for the price to retrace towards the breakout level. This could then be a good level to enter at. Stop loss placement should not be too close as this is a long term type of trade on a large timeframe. With a long entry on the black horizontal line which is at 1.34852, a stop loss can be placed at 1.32180 which is 267.2 pips away. A target of 500 pips or more can be used. This is just an example. It is important to note that technically the pair is still in a downtrend and that buying into it at this time is somewhat opportunistic. That’s why I would not recommend entering a long position before we get confirmation that the price has indeed broken through the current range resistance. This is what the downtrend looks like on a weekly chart:
GBP/USD Weekly Chart
Tomorrow we have UK CPI numbers and some other economic data out of the region which will be released at 08:30 GMT. Perhaps this could spark a further rise in the exchange rate, should the readings come out better than expected.
Have a great trading day!
- Check out our free forex signals
- Follow the top economic events on FX Leaders economic calendar
- Trade better, discover more Forex Trading Strategies
- Open a FREE Trading Account


