The US Dollar is Trading Lower After Yesterday’s FOMC Meeting, The Heavy USD/CAD Failed To Break Out Higher


We didn’t get a US rate hike after all. A hike wasn’t expected, but it would have been a splendid market mover if we got one. Perhaps December will be more fruitful, or perhaps we will only see higher rates in the United States next year. The FED keeps saying that rate hikes will be gradual and that they will remain data dependent when making those decisions.
The result of yesterday’s weakening of the US dollar has helped many of the major currency pairs to remain firmly in the ranges they’ve been trading in lately. It has been a continual struggle during the last few weeks. One day, the dollar performs very well. A few days later, the dollar falls again. True market direction is difficult to gauge at the moment, and I can bet that a lot of traders lost some money while trying to predict ‘the next big moves’ lately.
The USD/CAD and the USD/CHF have had some trouble keeping their heads up, especially after last night’s FOMC meeting which weakened the US dollar. These two pairs have been trading sideways for quite a while now. Ranges frustrate many traders, and at the moment that’s all we see when we look at the major currency pairs. Let’s jump to the charts.
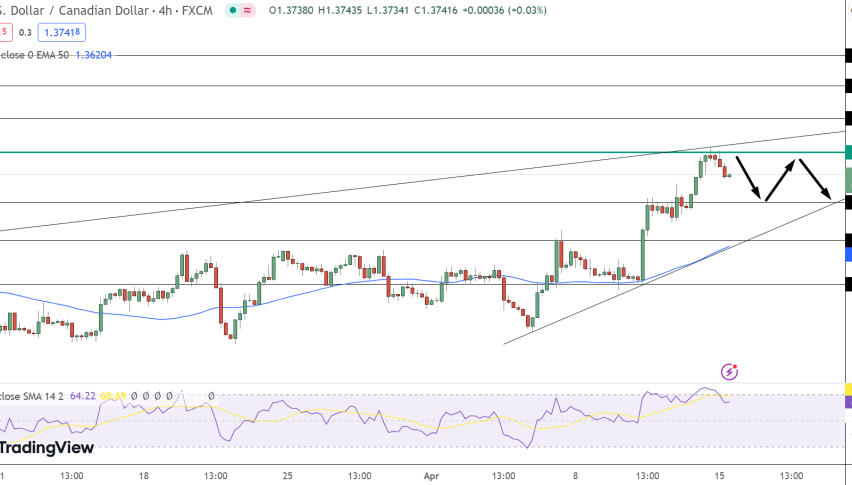
USD/CAD

USD/CAD Daily Chart
In this chart, you can see how the green resistance zone has been a solid barrier to the recent price action. In the last few weeks, the price has rejected off of this resistance zone no less than six times. It is clearly a very important price zone to keep an eye on. Notice how the slow stochastics indicator at the bottom of the chart pointed out the swings quite accurately. What a handy tool to use in ranging market conditions.
If you examine the chart closely, you will also notice how the 200-day moving average (the black moving average) has done a great job of resisting the price recently. This might change quickly, of course. Look at the following chart:
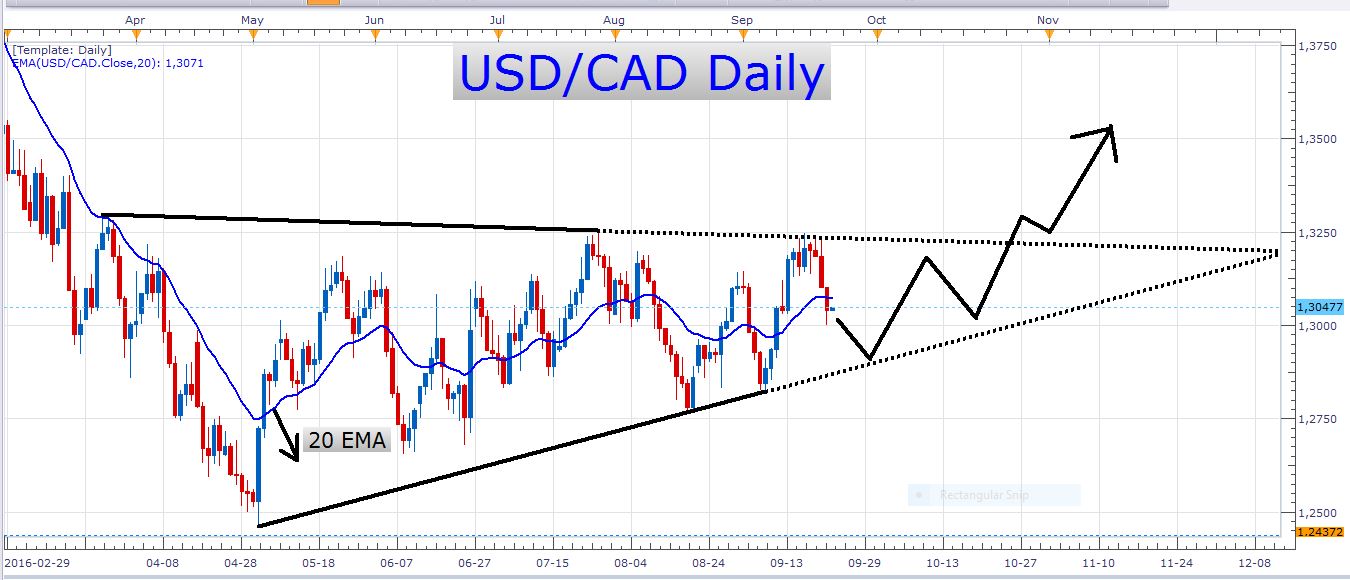
USD/CAD Daily Chart
This is what we call a wedge or triangle formation. As you can see, there are several higher swing lows which form the base of the triangle. This makes me careful to short this pair at the moment, except if we get a definite breakout through the base of the triangle. The triangle is fast approaching its apex, and the scope of a short position is becoming less and less attractive as we make our way to it. This chart depicts a scenario of a breakout through the ceiling of the triangle. Of course, it might not happen at all, but being prepared for it is what counts. Look at the other possible scenario:
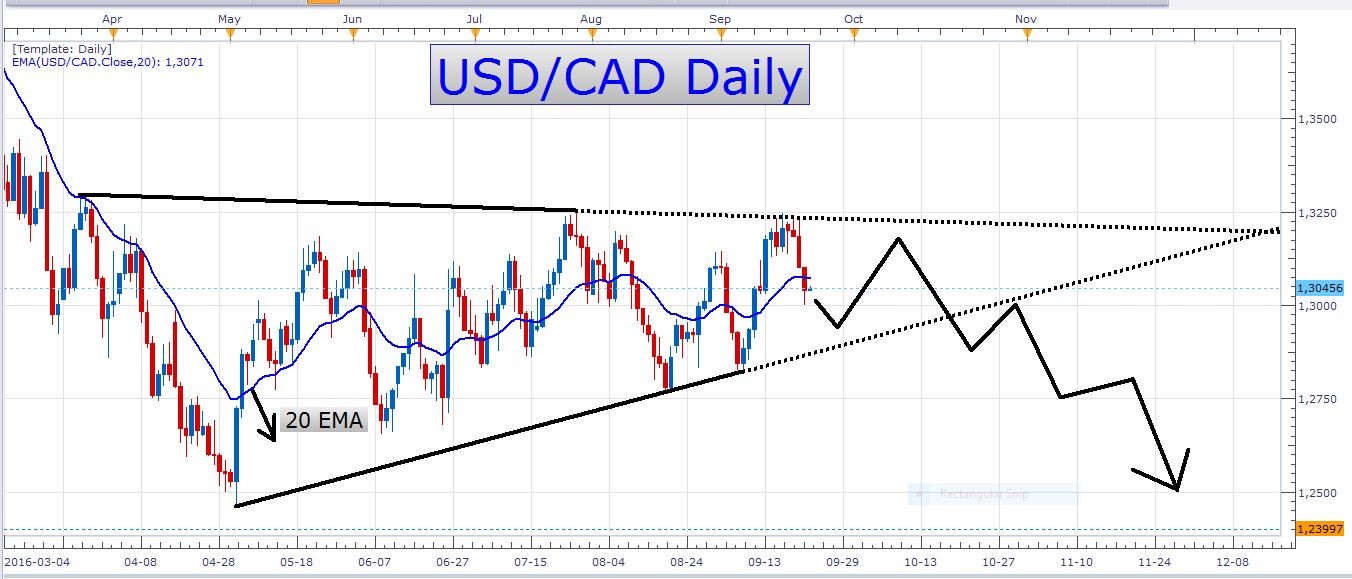
USD/CAD Daily Chart
We might get a further breakdown of the pair soon. If we see the price break through the floor of the triangle, and we get a firm close below it, there could be an opportunity to short the pair with a breakout pullback setup.
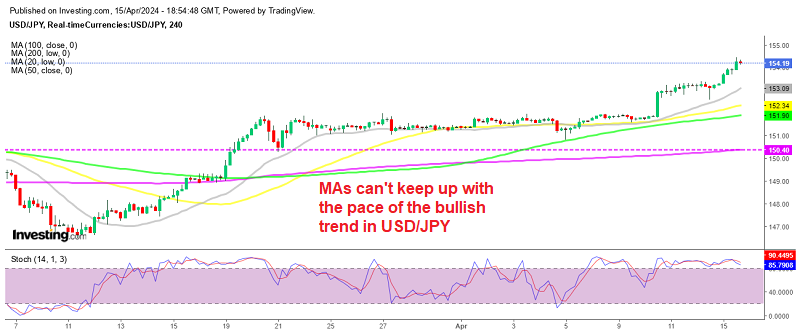
USD/JPY
This pair has recently met some serious support at the big psychological level which comes in at the round number 100. Nevertheless, no level is unbreakable, and if the bears keep on ramming against the support, it might eventually break. Look at this daily chart:
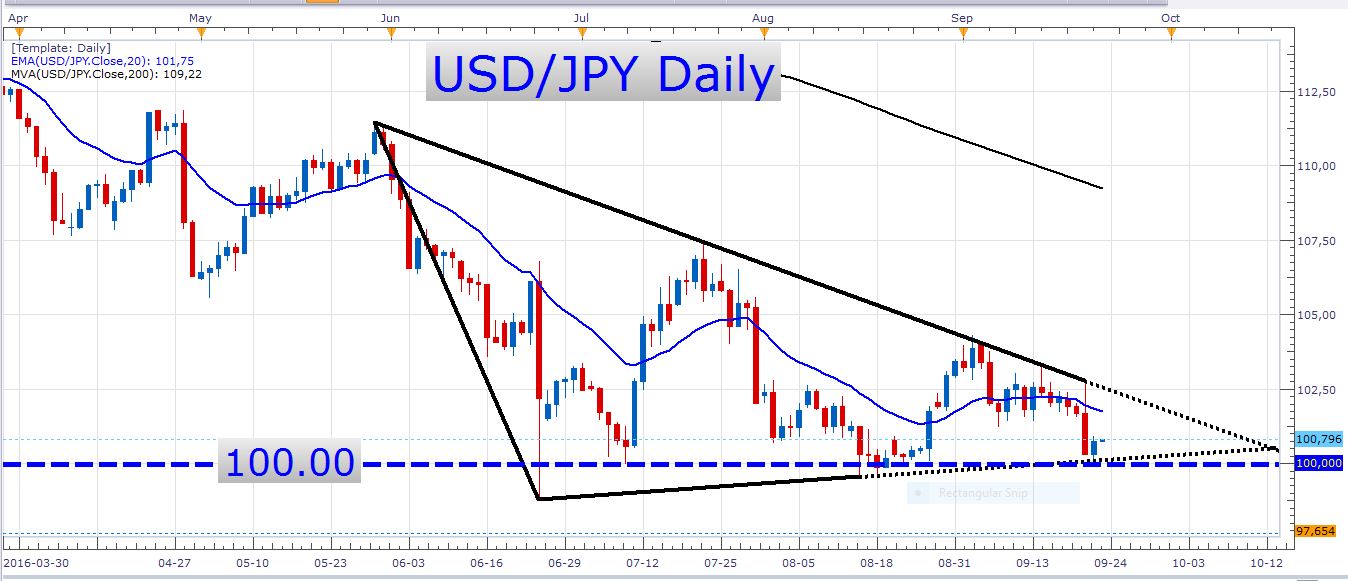
USD/JPY Daily Chart
Here we see that a very clean descending wedge has formed in the last few weeks. The theory behind a descending wedge is that the price normally breaks out lower from it. The blue dotted line marks the big psychological 100.00 level. I am not currently looking to buy this pair, but if I had to, I would place a pending order at 100.00. I am not ready to sell the pair either. I would only enter short positions after we’ve broken through the 100 level convincingly. Then I would wait for a retracement back towards the breakout point to sell the pair at.
Economic data
Tomorrow’s docket is fairly light, and the most important news is perhaps the Canadian Core CPI and Retail sales numbers. We also have preliminary German Manufacturing PMI numbers out tomorrow, as well as a couple of speeches by FOMC members later in the day.
That’s all for now, enjoy a prosperous trading day!