The big break in GBP/USD finally happened. The 1.2840-50 was a strong support level followed by another big level at 1.28. Yesterday the price broke the 1.2840-50 level but it didn´t close below it although the closing price in cable yesterday was the lowest since the mid-80s. The 1.28 level wasn´t touched so it remained intact.
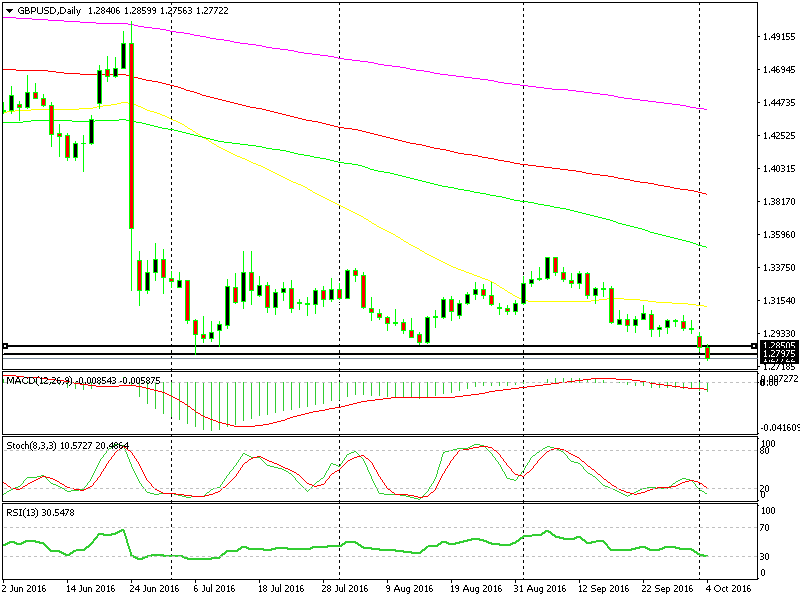
Finally, the support levels have been broken
Judging from the forex chart of this pair, you could argue last evening that the 1.2800-50 level might provide support once more. But, if you followed the market in the last few days you know that this is one of those times the forex market has made up its mind. This move down from 1.3440s about a month ago wasn´t like one of those 500 pip spikes which happen in one day but then the price reverses the following days.
This has been a slow but steady move and since it started last month, it felt like this was the time the big break was going to happen. British PM Theresa May delivered the final blow to the GBP/USD bulls with the Brexit comments on Sunday at the BBC. But the break came only tonight.
1.2850 was broken and the break of the 1.28 support level followed soon after, so these support levels are history now.
They might be history as support levels, but they´re still important to us; we know that once broken a support turns into resistance which you might sell against. So, this is the case with us right now regarding this forex pair. We are only looking to sell for two reasons:
1. The market is totally bearish towards the GBP since all sort of news have been followed by aggressive selling
2. The last support levels are now gone, we have nothing to lean on. Looks like there´s no end to this downtrend now.
So, for these two reasons we are leaving aside the buy option and not try to catch the falling knife. If not buying, then we must be looking to open a sell forex signal. The question is where?
Well, the 1.28 ex-support level looks like a good spot to enter a sell position, but only for a short term trade. 1.2850 looks more enticing, but that´s still too close to the price right now, so if the price gets back up there soon then the technical indicators won´t be oversold, which again is not a good trade setup for a long term trade.
1.30 and 1.31 are good spots to sell if the price moves up there this week or early next week. By that time, the indicators will become oversold on the daily or H4 forex chart which will be the signal for us.
If the price hangs around here too long, then the lower ex-support levels (1.28. 1.2850, 1.29) will start to become more important s resistance levels. So, if the price stays around here or moves further below in the next few days, then the lower resistance levels is where we are looking to sell.
But, that depends on the pace of the move and on the technical indicators as well, so we advise that you follow our live posts for more updates on this forex pair. Forex is very dynamic and everything changes in a blink of an eye, so although this is our analysis for now, we will adapt to market changes and play according to the new environment.