Technical Analysis – Is USD/JPY Finally Reversing? Buy or Sell?
USD/JPY has been in a constant downtrend this year. It´s been a wild ride, especially during February and June. The price has even dipped below 100 a couple of times, but all in all, the 100 level is considered the ultimate support level.
In the last two weeks though, we have seen a sequence of eight consecutive days of gains. This forex pair has never had eight consecutive winning days so far this year, so although this is far from a reverse of this year´s downtrend, the technical setup is certainly a signal. This gave us a reason to have a deeper look at the bigger technical picture of this pair.
I think that this technical analysis would work better if we divide the arguments pro and against the reverse. So, we´re ranking the indicators in two groups, pros and cons.
Pros
8 consecutive winning days – We haven´t seen many consecutive winning days in this forex pair this year. In fact, looking at the daily forex chart of USD/JPY, I can´t see 8 consecutive winning days in about two years. This is a big pro.
The break of the 100 MA – The price broke above the 100 MA (moving average) for the first time in many months today. Since early February when the financial markets went through a period of panic, we have never seen the price touch this MA on the daily chart, while today it broke above it and looks like it will close the day there.
The 100 support level remains intact – The 100 level has been broken a couple of times after the Brexit referendum among the search for safe heaven. But, the buyers have piled on every time the price got below or close to this level. It threatened the 100 support level a few times last week but the buyers kept pushing the price up. Now it looks like the sellers have given up.
The break of the Downtrend line – On the weekly forex chart we can see that the ascending trend line hasn´t been broken since February. This week the price broke above it and it now sits about 300 pips higher.
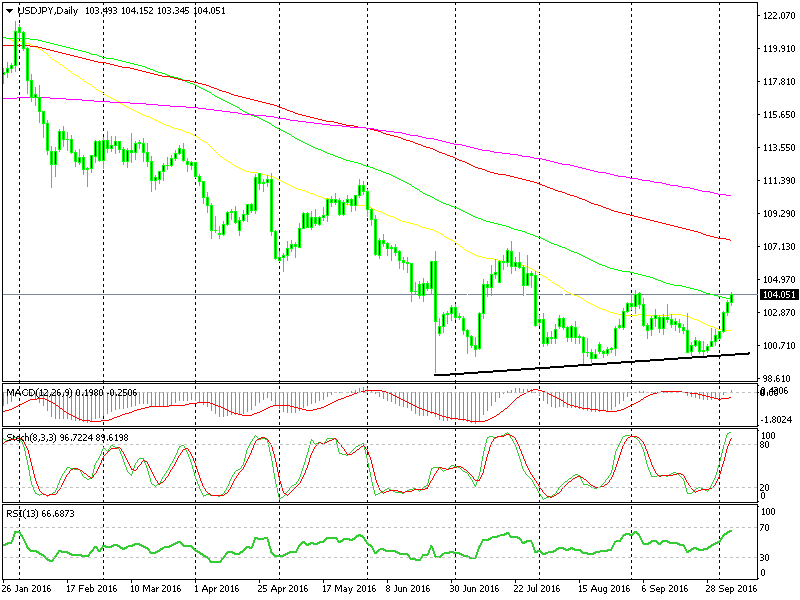 The price broke above the 100 MA today for the first time in a long time
Cons
Nothing exceptional – This 400 pip move higher is a considerable fight from the buyers, but it is not a really strong sign that this is a reverse of the downtrend. We have seen bigger retraces than this in the previous months this year, so nothing exceptional here.
No confirmation – We ranked in the pros the fact that the price finally broke above the 100 MA today. But we don´t have a confirmation yet. The price needs to close above it today and remain there for the next few days.
Oversold indicators – The stochastic indicator is already oversold on the daily chart and the RSI is close to oversold levels. Every time these technical indicators reached overbought levels this year, the sellers jumped in and pushed the price down. This might be just one of those times.
Note: Let´s suppose that the market sentiment might have turned around and everyone is convinced that this is the long-awaited reverse. But if a handful of sellers start selling at the 100 daily MA the sentiment might reverse just like that, that´s the nature of this business.
The 200 MA – The price broke above the 200 smooth moving average as well today on the weekly chart, but it´s still too early to consider this a proper break. The price has to close the week a substantial amount of pips above it to be considered as a break. Otherwise, this will be a tough obstacle to overcome, since it has provided solid resistance before.
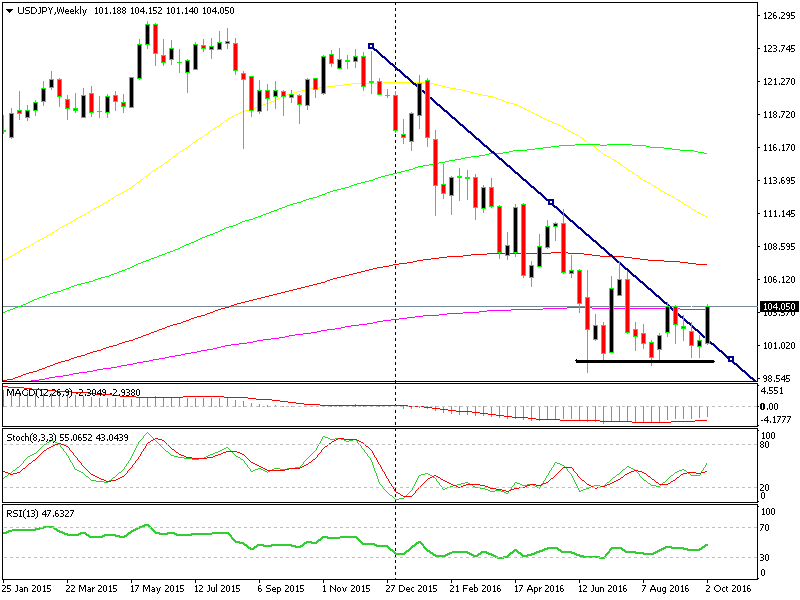 The break of the 200 SMA hasn´t been confirmed yet
This is the technical analysis of USD/JPY with all the major pros and cons of the big reverse. As you can see it´s a draw, but I have the feeling that this might just be the reverse we are all waiting for. Anyway, we will take a look at the fundamental picture to see which side the fundamental analysis will lean on. Only then we will decide whether to buy or to sell this forex pair, so check us again tomorrow.
- Check out our free forex signals
- Follow the top economic events on FX Leaders economic calendar
- Trade better, discover more Forex Trading Strategies
- Open a FREE Trading Account
- Read our latest reviews on: Avatrade, Exness, HFM and XM
Related Articles


Sidebar rates
Related Posts
