Crude Oil Rips and the USD/CAD Dips
The Canadian dollar got a tremendous boost from the sudden pop in oil prices today. The Russian president Vladimir Putin said that Russia will support OPEC’s proposed oil production freeze, and also called on other oil exporters to do so. This lifted Brent crude to a 52-week high.
I had high hopes for a continuation of Friday’s bullish momentum on the USD/CAD, but it might take a lot of energy to push the pair back up to Friday’s high again, especially if oil prices continue to rise over the near-term. The strong close we witnessed on Friday was very appealing to me, especially because it cleared the 200-day moving average as well as an important resistance zone. The long trade idea could still pan out some gold, but today’s decline was a bit too aggressive for me to just jump into a long position at the moment. The Canadian dollar is highly correlated to the oil price, and if this commodity keeps on getting more and more expensive, the Loonie, as Canada’s currency is also called, could recover even more of its recent losses to the USD.
After today’s dreadful decline in the USD/CAD, which started out with a gap lower when the market opened, there is still a lot of scope for a bullish outlook on the pair. Something that compels me to still consider the long side on this pair, is the fact that the price is still holding above the 20-day exponential moving average. Something else to keep in mind is that on a daily chart we’ve recently witnessed the formation of higher swing highs and higher swing lows. This is a good characteristic of a healthy uptrend. Let’s look at some charts:

USD/CAD Daily Chart
In this rising channel, we can see that the pair has been trading higher in a controlled fashion, and constantly printed higher highs and higher lows. Every time that the sellers managed to produce a deep retracement in the pair, the bullish participants were able to defend their territory and also gain some extra ground in the process. We shouldn’t forget that Friday’s candle recorded a new high and that perhaps today’s dip in the exchange rate was just another one of the many retracements which formed higher swing lows and ultimately led to the formation of higher swing highs. Let’s look at an hourly chart:
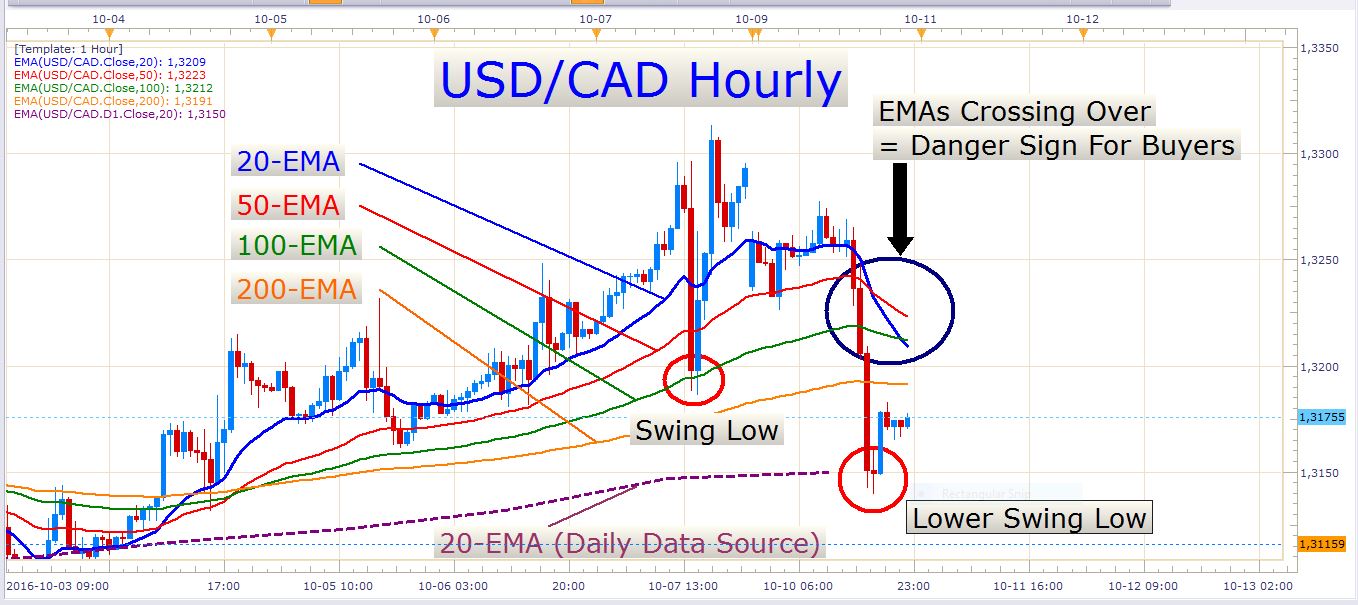
USD/CAD Hourly Chart
Can you see the structural transition that occurred here? At first, the EMAs (exponential moving averages) were aligned with one another, and the pair was printing higher highs and higher lows. Then we had today’s massive decline. Now the 20-EMA has started to cross over the 50-EMA and the 100-EMA. Besides this, a lower swing low has been set in place which is the last thing a prospective buyer wants to see on a chart (except in some cases where the end of a three wave correction signals the start of a new bull run in Elliot Wave Theory).
So what do we need to wait for? Or what kind of signal can we use to enter some long positions? We can wait for new higher highs and higher lows. We can also wait for the bullish momentum to return to the market. As soon as we see the exponential moving averages aligned with each other again, with the 20 at the top, sequentially followed by the 50, the 100, and the 200, we can know that we once again have strong bullish momentum in the market. After we have these confirmations, we can then look for price retracements to further fine-tune our long entries. I like to take entries between the 20-EMA and 50-EMA, especially if I see a favorable candlestick formation, like a hammer candle, or some other pinbar type of candle rejecting off of one of these EMAs. Look at the following example:
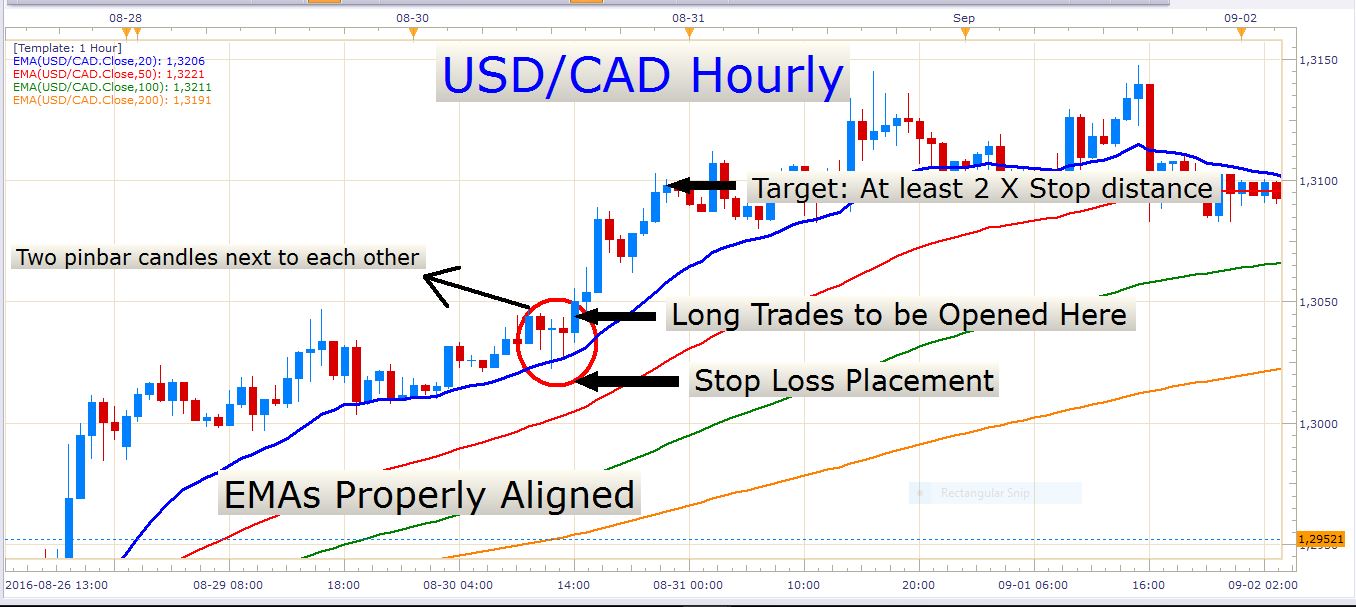
USD/CAD Hourly Chart
The chart says it all. Here you can see that the two signal candles both rejected off the blue 20-EMA and offered a splendid opportunity to get long with a favorable risk to reward ratio.
News events
Tomorrow we have another quiet day in terms of economic news, with nothing really worth mentioning.
Keep an eye on the GBP/USD and pound crosses for short opportunities. The retail sentiment on Cable points to further losses in the exchange rate, and it is likely to offer larger directional moves than the other major pairs at this stage.
Have a profitable day!
- Check out our free forex signals
- Follow the top economic events on FX Leaders economic calendar
- Trade better, discover more Forex Trading Strategies
- Open a FREE Trading Account
- Read our latest reviews on: Avatrade, Exness, HFM and XM
Related Articles


Sidebar rates
Related Posts
