Canadian Dollar Strength is History, the USD/CAD Uptrend is Back on Track
Last week Wednesday the Canadian dollar received a blow from the Bank of Canada’s governor Mr. Stephen Poloz when he said that the central bank actively discussed the possibility of additional economic stimulus. He also said that policymakers wanted to use monetary easing to speed up the economy's return to full capacity. The BOC (Bank of Canada) kept their benchmark interest rate unchanged at 0.5 percent which lifted the Canadian dollar somewhat, but when Mr. Poloz delivered his speech an hour and fifteen minutes later, these gains were quickly wiped out. Crude oil’s strong performance on the day supported the Canadian dollar somewhat, but the USD/CAD printed a daily pinbar candle on Wednesday which definitely whetted the bullish market players’ appetite for more long exposure. Look the following chart:

USD/CAD Daily Chart
As you can see, the bulls gained a lot of ground on Thursday and the pair closed about 114 pips higher. You will often see continued buying on a day that follows a strong pinbar candle like the one in the chart above. On Friday this advance continued, and the pair rocketed higher when the Canadian retail sales and CPI prints disappointed market expectations. The great miss was the core retail sales number which came in at 0.0% while the forecast was for a rise of 0.3%. These weak data points caused a mighty bounce of about 116 pips in the USD/CAD which you can clearly see on this 5-minute chart:

USD/CAD 5-Minute Chart
The strong rise in the exchange rate over these last three days has definitely flushed out many bearish market players from the market. Remember that a seller can only exit his position by buying, which adds even more fuel to a bullish move like this. I reckon we could see some more Canadian dollar weakness in the next few weeks which would send the USD/CAD even higher. The pair broke through the previous swing high which was formed on the 7th of October to form a higher high. It also closed above the 200-day moving average on Thursday and Friday which further establishes my bullish bias.
So how can we trade the USD/CAD in the week ahead? As I often say, I don’t like to chase the price when I trade. If you’re chasing the price, you are trading on the market’s terms. If you wait for the price to retrace to levels you find attractive, you’re trading on your own terms. At the moment the price is quite overextended and has moved a long way without a notable pullback. Look at the following chart:
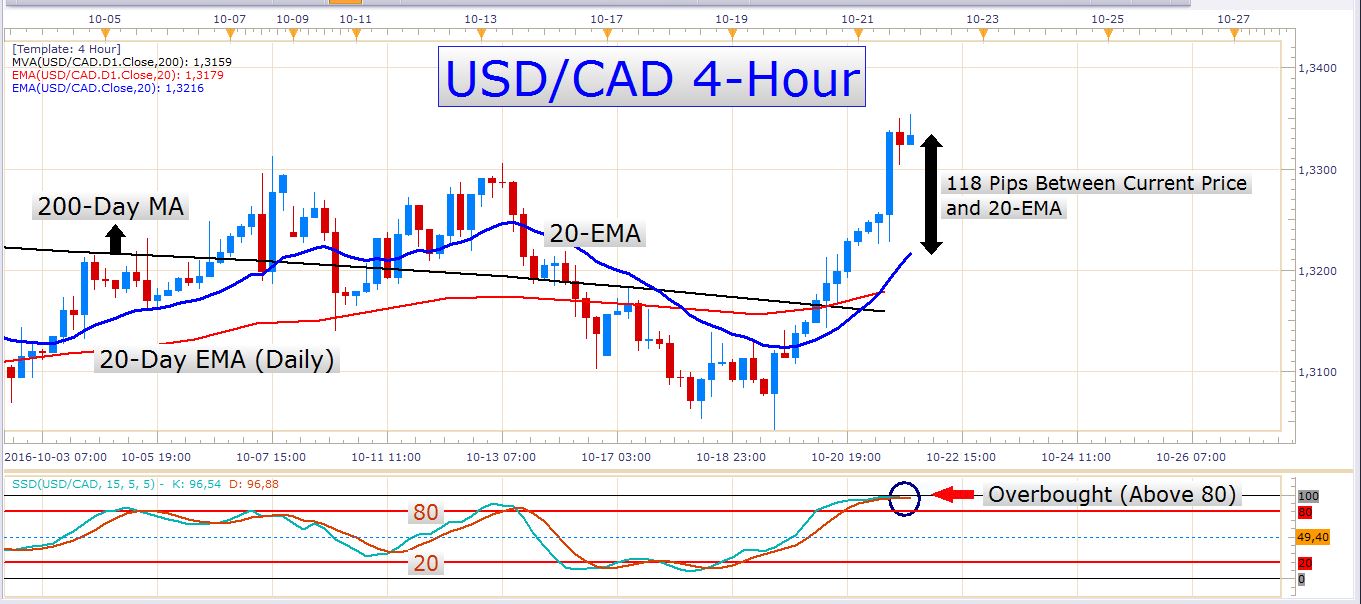
USD/CAD 4-Hour Chart
Here you can see that the current market price is far from the 20-EMA and the slow stochastics oscillator is in overbought territory. Now we know that an instrument’s price can remain in an overbought condition for long periods before making a pullback and that traders could possibly make a profit by buying an overbought currency pair, for example. However, we as traders are not interested in possibilities, but rather in probabilities. When you open a trade, you need to know that you have a good chance of making a profit and that the odds are in your favor. Buying a currency pair that is already overbought doesn’t normally give you an edge. Buying on a pullback in a strong uptrend does. Using different tools and indicators to fine-tune your entries can further increase your odds of being profitable.
Now if we wait for a pullback to the 20-EMA on a daily chart, it could take a few days before we get an opportunity to enter a trade. If we look at 4-hour and hourly charts, we will find more trading opportunities. Many times the price moves in a certain direction for an extended period of time without making a pullback to, for example, the 20-EMA on a daily chart. In this same period, the price could perhaps have touched the 20-EMA on an hourly chart several times which could have been great opportunities to enter trades. Look at the following chart:
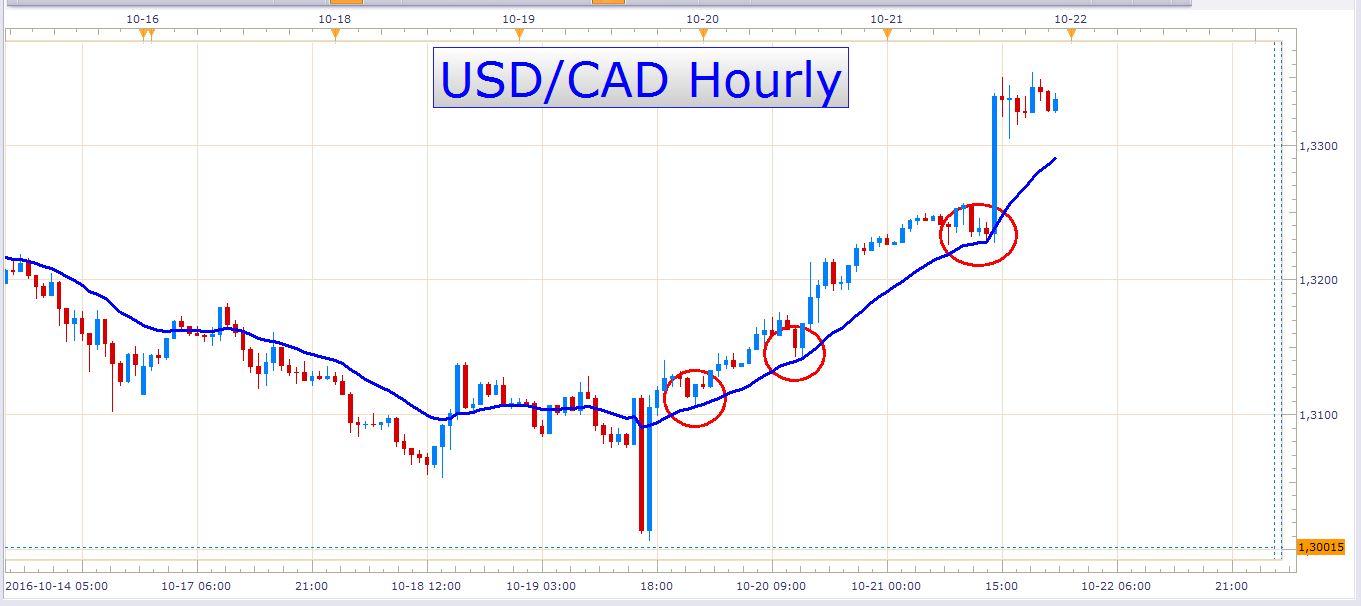
USD/CAD Hourly Chart
The red circles indicate instances where the price retraced to the 20-EMA. You will notice that these were pretty neat entries and that it was possible to enter these trades with really tight stop losses and large targets. Remember that traders shouldn’t just trade any pullback to the 20-EMA. Sometimes the price makes aggressive corrections that can move right through the 20-EMA with ease. This is where market experience comes in handy. When entering on pullbacks in an uptrend, it is important to observe how the price reacts to the specific levels you are watching, and how strong the pullbacks are. Ideally, you want to buy weak dips in an uptrend. If you look at the hourly chart above, you’ll notice that all the touches to the 20-EMA were preceded by weak dips. The candles of these corrections are relatively short and indicate to us that the selling that produced these pullbacks were mild, and not aggressive. Furthermore, it is good if you can find candles with wicks rejecting off the 20-EMA or the specific level or indicator you’re watching. This indicates that the bulls are stepping in again and that there is a good chance that the trend will resume its course again. This is just an example of trading in an uptrend. The same principles can be used to trade downtrends, just turn everything around.
This week the only economic data out of Canada is the wholesale sales number that will be released tomorrow (Monday). This release carries moderate importance, but I don’t expect it to be a massive market mover.
The US dollar has performed very well lately and continued dollar strength could cause the USD/CAD to rise even more, especially if the Canadian dollar continues to weaken. Look at the following chart of the US Dollar index:

US Dollar Index Daily Chart
This is an index of the US dollar’s performance against four major currencies namely the Australian dollar, Euro, British pound, and the Japanese yen. It gives us a good idea of general dollar strength.
Here you can see just how well the dollar has performed over the last couple of days. Going into the week ahead, we could encounter even more dollar strength. On Friday the dollar strengthened against all of the major currencies with the exception of the Japanese yen which gained only about 12 pips against it.
EUR/USD
The Euro has lost a lot of ground against the Buck in the last couple of days. Since the last important swing high on the 18th of August, the pair has shed about 480 pips. Look at the following chart:
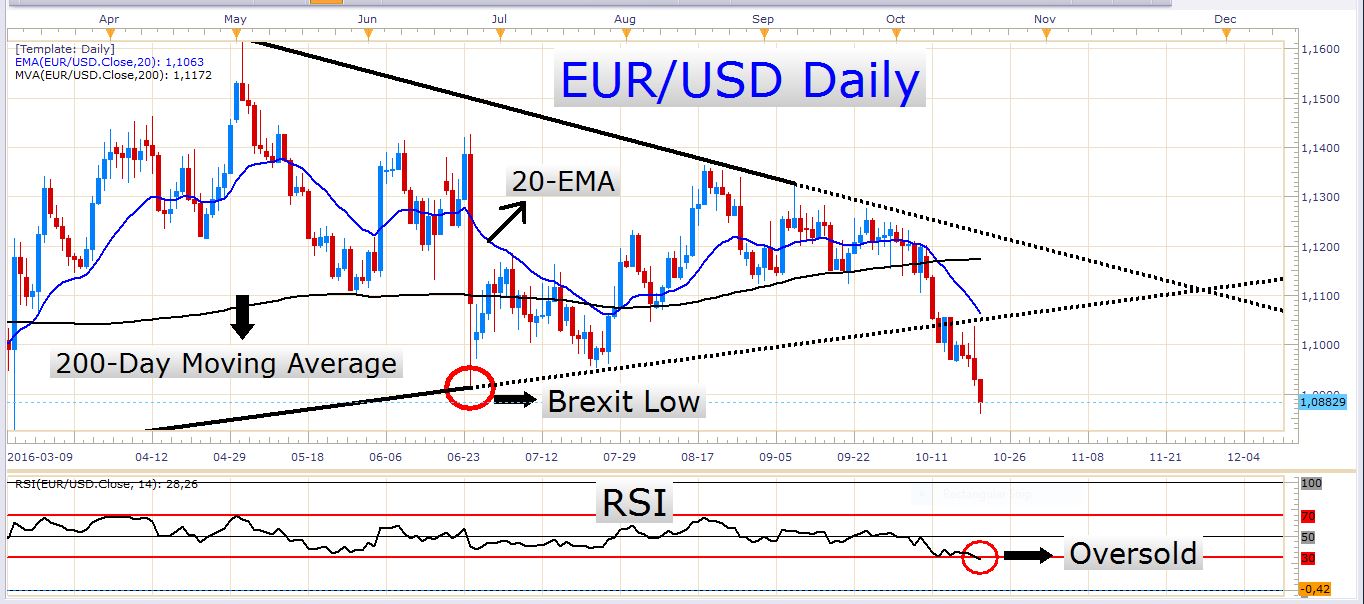
EUR/USD Daily Chart
As you can see, the pair recently broke out of a type of a wedge formation and is trading well below the 200-day moving average and the 20-EMA. It has cleared the Brexit candle’s low, and the RSI indicator is currently giving us an oversold reading.
I suspect that there could be some kind of a correction on the way on this pair, and I would not like to sell it at the current levels. I don’t like chasing the price, I’d rather wait for a better level to enter at. Perhaps the pair will continue to fall even further without producing a notable pullback, but at some point, it will correct higher. Despite the recent selloff in the EUR/USD, the bigger picture of the pair reveals that it is still trading in a large range. Look at this weekly chart:
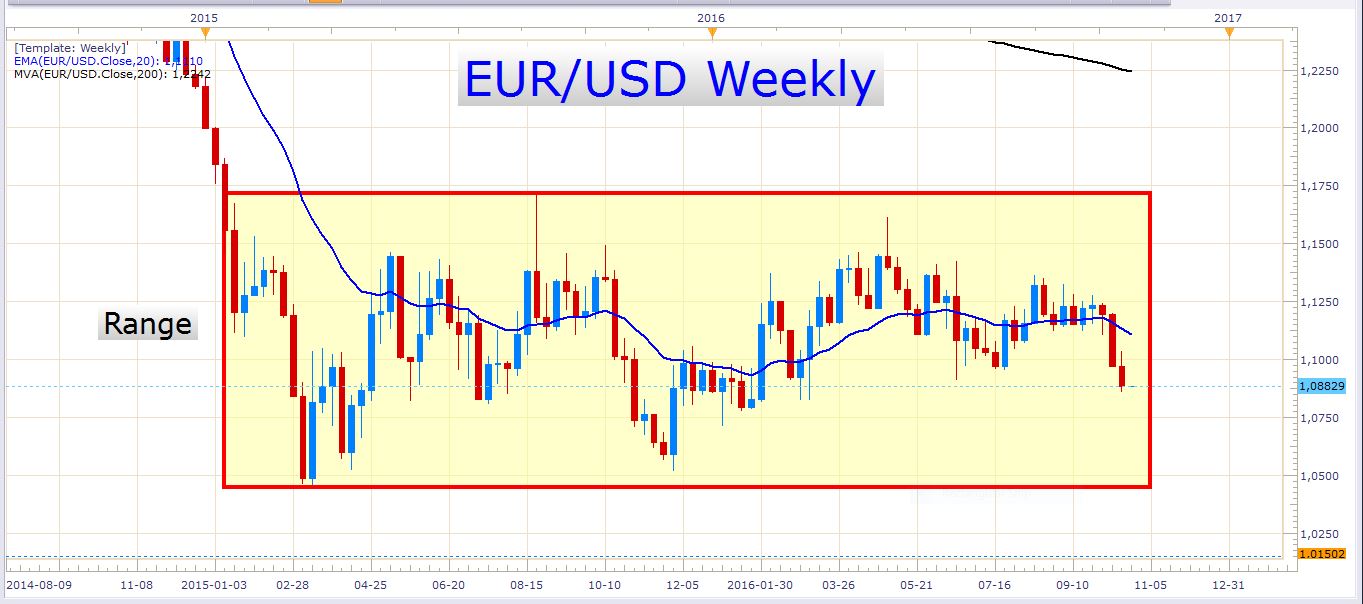
EUR/USD Weekly Chart
There are two important news events regarding the Euro this week. The first is the German manufacturing PMI number which is scheduled for tomorrow (Monday) at 07:30 GMT. The second is the German Ifo business climate index number which will be released on Tuesday at 08:00 GMT.
Out of the US we have the following important news releases:
-
CB consumer confidence (Oct) – Tuesday at 14:00 GMT
-
New home sales (Sep) – Wednesday at 14:00 GMT
-
Crude oil inventories – Wednesday at 14:30 GMT
-
Core durable goods orders (MoM) (Sep) – Thursday at 12:30 GMT
-
Pending home sales (MoM) (Sep) – Thursday at 14:00 GMT
-
GDP (QoQ) (Q3) (preliminary release) – Friday at 12:30 GMT
All of these events have the potential to move the FX market. The crude oil inventory numbers mostly concern the Canadian dollar (of the major currencies), but the other releases could impact the EUR/USD directly.
USD/CHF

USD/CHF Daily Chart
What caught my eye on this chart, is Friday’s pinbar candle that rejected off of the range resistance. This raises the question whether this pair will find the energy to break out of this range. Now the way we can take advantage of this situation is by shorting the pair at a breach of the low of Friday’s candle. Look at the following chart:

USD/CHF Daily Chart
The idea is to have some kind of confirmation that the price is falling back lower before we enter a trade. You can place a pending sell order at the level indicated on the chart so you don’t have to sit and wait in front of your screen for the price to reach this level. The stop loss and take profit orders need to be placed simultaneously with the sell stop order. You can split your position into two orders if you’d like to aim for a larger target with the second order. The stop loss can be moved to break even when the price has reached 50 to 60 percent of the distance to the take profit. Good money management suggests that you don’t risk more than two percent of your capital on any setup. The ideal is to risk one percent or less.
Other important news events this week
On Wednesday the Australian third quarter CPI number will be released at 00:30.
On Thursday we have UK third quarter GDP numbers at 08:30 GMT
Best of luck with your trading!
- Check out our free forex signals
- Follow the top economic events on FX Leaders economic calendar
- Trade better, discover more Forex Trading Strategies
- Open a FREE Trading Account
- Read our latest reviews on: Avatrade, Exness, HFM and XM
Related Articles


Sidebar rates
Related Posts
