As we mentioned it earlier today and as my colleague Eric highlighted, the USD has become the lame duck of the pack. It used to be the chief of the whole major currencies gang until a couple of days ago as it marched higher during most of October.
But, the forex market never offers a stable environment for more than a few weeks and now the market sentiment has changed again, it shifted from trading the FED and the rate hike decision to trading the US presidential polls/elections. There are many pieces to this puzzle, but the main reason for this relentless USD selling is the broad risk aversion sentiment which has gripped the financial markets, as the US bonds slip lower.
As we know, one man´s trash is another man´s treasure, so the elevated volatility has given us a rough time in the last few trading session, but that has opened the door to several good trading opportunities. We couldn´t find good trading opportunities for long term signals in October, but the price is getting close to some decent support/resistance levels or moving averages on the higher timeframe charts of several forex pairs.
One of those pairs is GBP /USD. The situation for the British Pound is hopeless as long as the Brexit drama goes on, so fundamentally the future is set for this forex pair and it looks pretty bleak, despite the other half, the USD part which is has offered some volatility in the last two days and will likely continue to do so for another week until the US elections are over.
So, all that´s left for us is the technical analysis. If you look at the weekly or monthly GBP/USD chart searching for a decent level which might bring an end to this recent rally, you won´t be able to find any anywhere near. Technically, this forex pair looks like a desert where you can´t see anything for hundreds of miles around. If you try too hard to see any meaningful resistance levels around here where you can open a sell forex trade, you´ll probably end up looking at a mirage, because there isn´t any.
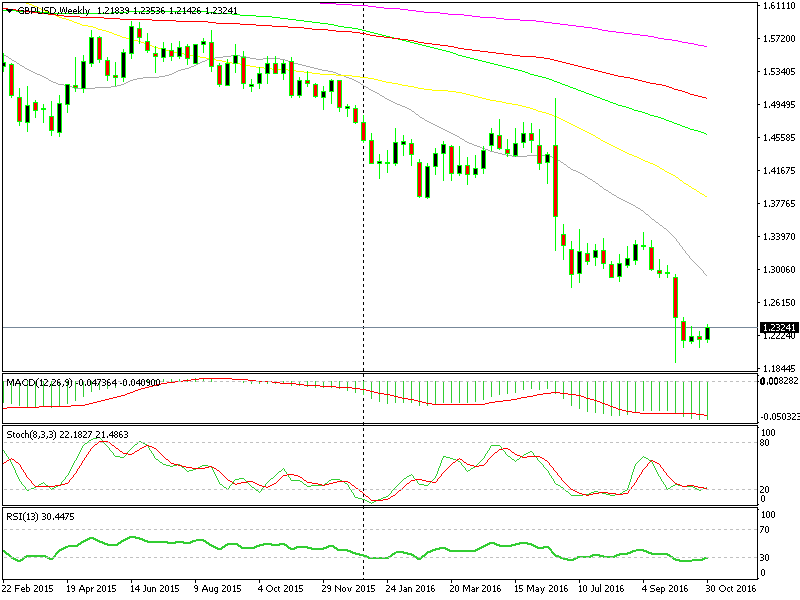
The last swing low is nearly 500 pips above at 1.28 followed by the 20 moving average in gray at 1.2820s
The first decent support-turned-resistance level comes at 1.28, followed by 1.2850-60. These levels have been providing solid support for several months after the Brexit referendum, but they had to let go at some point so there´s no question about their strength if we get up there. The million Dollar question is will the price push that far up with all the Brexit negativity surrounding GBP pairs?
Personally, I have my eyes set at another level. If you have followed the GBP/USD price action before the second flash crash of the GBP, the 1.26 level was the breaking point. That was the edge of the cliff, after taking the final step GBP/USD dived 700 pips and has never recuperated since then. So, that is the level I´m watching.
The price is quite far from there now, but with the sort moves we have seen recently, nothing is off the table. The stochastic indicator is oversold and by the time we get there the RSI indicator will become overbought as well, so the selling pressure increases.
Anyway, in case the buyers get cold feet before reaching 1.26 I will also consider 1.25. These round numbers always count for something, but we´ll see how fast the price gets there. If it takes too long, then that will be the make or break level for us. Anyway, we´ll reevaluate the situation judging by the price action in the coming days, so check us back for more clues which might resurface in the meantime.