February 20th Morning Brief – An Update on the Bullion Market


Welcome back! Let's start the new week with excellence! Today in the Morning Brief, I will be sharing insights on the bullion market.
Last week, the precious metal traded sideways as it opened trading at $1232.50 and closed at $1234.30, with a neutral to unsettled sentiment of investors. There was a "tug of war" game between the technical and fundamental analysis.
On one side, the bullion remained supported by the U.S president and an uncertainty caused by him in the market. On the other hand, the bullion remained under pressure from hawkish remarks by Fed Chair, Janet Yellen, regarding the unwise decision to keep rates low for a long period of time, rousing sentiments that the interest rate hike is on the way.
The U.S Dollar Index, the bullion negatively correlated currency, trades at $100.92, adding +0.03 points and +0.03% in the early Asian session while having posted a weekly high of $101.76 and a low of $100.41 in the last week, which also supported the bearish momentum in the Gold and Silver.
Today on the 20th of Feb, the U.S banks will be closed in observance of President's Day and the volatility is likely to remain low. So, most of the focus will remain on the technical analysis.
Gold, The Safe Haven Asset
The precious metal gold is trading at $1,234.85, falling -4.25 points and -0.34% in the early Asian trading sessions. Last week, the Labor Department of U.S reported an increase in unemployment claims by 5000. The actual figure came out as 239K, missing the expectation of 234K, whereas the sentiment was compensated by the Philly Fed Manufacturing Index that surged to 43.3, beating the previous figure of 23.6 in January.
Today, I don't see any major event that is likely to influence the yellow metal and the market is likely to follow the technical trading levels.
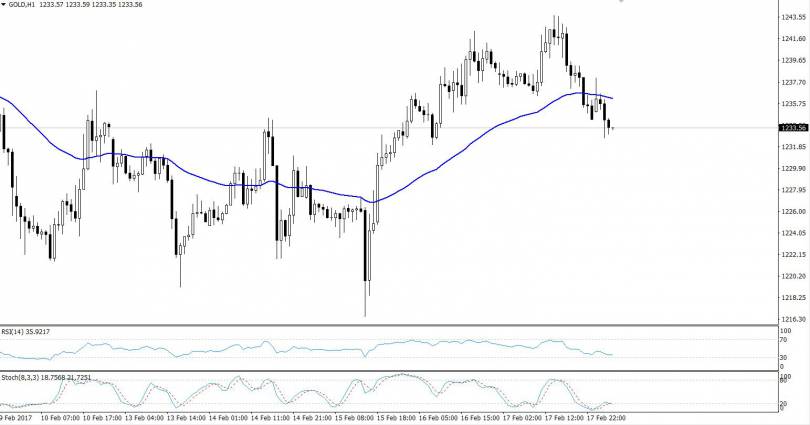
Let me drag your attention towards the technical side. We can see in the chart that the precious metal gold was trading in the overbought territory and plunged to trade at $1233 to complete the 38.2 Fibonacci retracements in the 4 – hour timeframe. Besides that, we can also observe a double top pattern that’s providing a major resistance to gold at $1243. Overall, the ascending triangle pattern in 4- hours is another indicator of a bullish trend, but at the moment, buying is risky as the precious metal can go for a 61.8% retracement.
I would ask you guys to wait a bit for a clear trend. The breakage below $1233 is likely to lead Gold towards the target level of $1230 & $1227. While on an upper side, it may target $1237 & $1243. Selling is below the recommended level at $1233 with a take profit around $1229.
Silver, the Positively Correlated Metal with Gold
Likewise, the Silver is also trading on a lower side at $17.943, down -0.087 points and -0.48% on a stronger U.S Dollar as the investors are still trading the sentiment developed in the last week by Fed Chair, Janet Yellen. Besides that, the renewed tensions around the globe, particularly from the U.K and the Eurozone, are still supporting bullion.
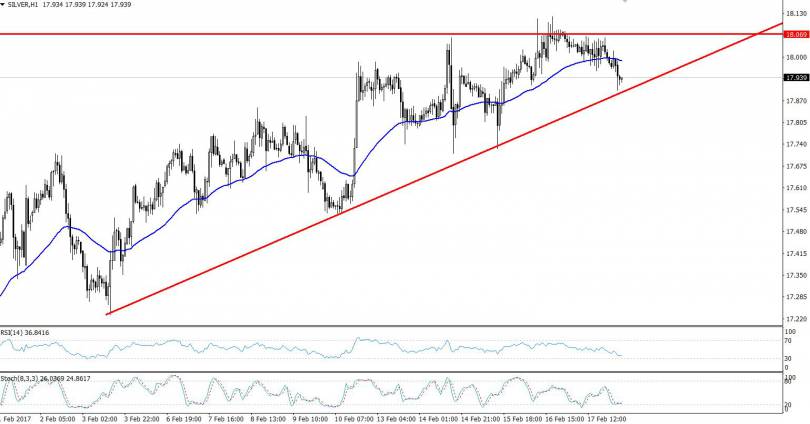
The technical side of Silver suggests a bullish bias of the metal. Like Gold, the Silver has also formed an ascending triangle pattern in the 4 – hour that’s providing it a support at $17. 89. The most recent resistance can be found at $17.99.
Investors are suggested to keep a close eye on $17.92, as we can have a selling position only below this level with a target of $17.85 and stops above $17.95.