There Goes 1.05 – How to Read the Price Action


After many attempts by the sellers, the 1.05 level in EUR/USD finally gave way. Actually, EUR/USD sellers reversed their trades about 10 pips higher during the last few days, but on Tuesday last week, the price did pierce the 1.05 level for a few hours.
It reversed and traded all the way up to 1.0630s this week, but now we are back below it. I mentioned in our previous updates that the price action was pointing down.
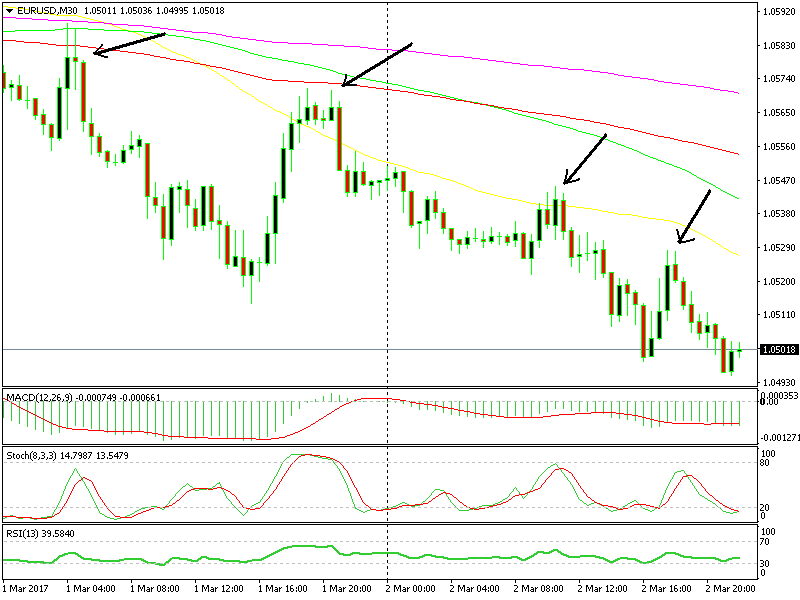 Can you read the price action from this chart?
You don´t have to be a genius to read this sort of price action; in the last few days the sellers have been increasingly targeting the lower 1.05 levels, which means that the selling pressure has been building up.
Apart from that, the highs have been getting lower every time, the first retrace higher reached 1.0589 yesterday, then 1.0572. Today we saw 1.0545 in the morning, while the second retrace barely reached 1.0529. That was the last fight from the bulls.
That said, there hasn’t been any real follow through so far and at the moment we are back above 1.05 now, but the liquidity is low at this time of day, so I don´t expect much action from now on. As long as we don´t go too far up which might scare the sellers, the sellers should remain in control.