Gold Stuck In A Range – When Can We Expect A Breakout?
The weaker dollar, the slump in the stock markets and lower returns on bonds are collectively impacting the prices of safe-haven assets. Yesterday, the global stock markets came under a sharp sell-off in the European session with losses driven by a distinctive drop in the U.S equity markets. The Nikkei fell around -0.37% along with the S&P 500 index, which plunged to a 5 month low of 1.24% on Wednesday.
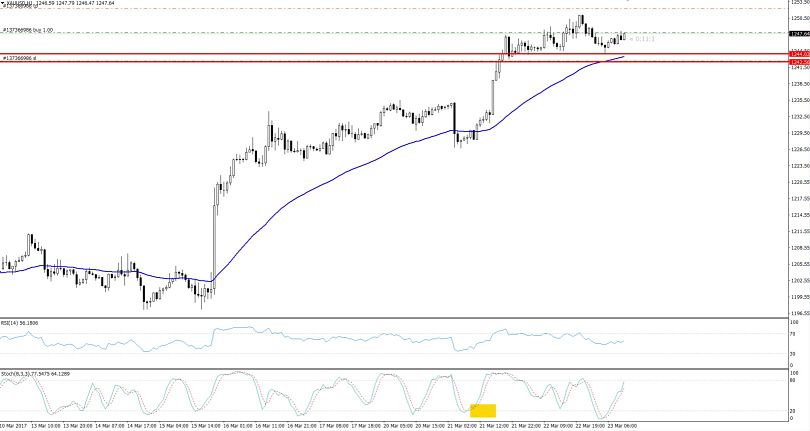
Consequently, investors panicked and dramatically picked up the demand for the haven asset, gold, causing a massive rise in the prices, from $1226 to $1251, in just two days. But since yesterday, the yellow metal has stuck in a narrow trading range of $1244 – $1251. Our take profit on a Gold Signal is $1252. Unfortunately, the gold missed our target by just 9 pips and now it's holding at a breakeven level.
 Gold – Hourly Chart
Technical Outlook
Let me highlight the technical side of the instrument. The leading indicators, both the RSI (above 50) and Stochastics (at 74), are recommending bullishness in the metal. In addition to this, the lagging indicator, 50 periods EMA, is also providing support to the bullish bias of investors. Perhaps, very soon, it's going to complete an asymmetric triangle pattern in the 1-hour timeframe, which would represent the neutral sentiment of investors regarding Gold.
On that note, I have decided to hold my buy position with a take profit at $1252 and a stop loss at $1242. Now, all eyes are on the U.S jobless claims that are due later today, at 13:30 GMT. Hopefully, they will suceed in surprising the market.
- Check out our free forex signals
- Follow the top economic events on FX Leaders economic calendar
- Trade better, discover more Forex Trading Strategies
- Open a FREE Trading Account
 Gold – Hourly Chart


