Global stocks have been under pressure over the past few days due to increased demand for safe haven assets. In particular, the Japanese stock market index Nikkei kept on consolidating in the brief trading range of $18200 – $18500 over four consecutive trading days. However, it has finally decided to break out of the range to place another high. This is something we predicted in our previous report.
The bullish moves came in response to the latest updates from Japan. Their exports surged at an annualized rate of 12% for the month March. The figure has been rising for four consecutive months, which is a very good sign for their economic growth. Besides this, Japanese imports have gone up 15.8% in March.
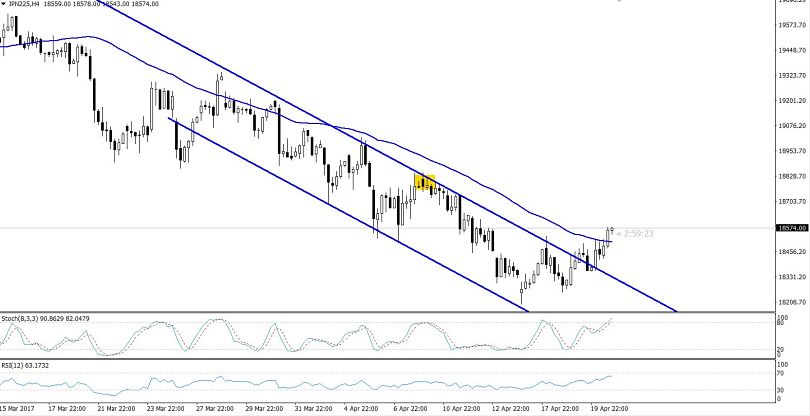 Nikkei – 4 Hours Chart
Technical Outlook
In the 4-hour chart above, the Nikkei has finally broken out of the many week's bearish channel at $18450 and it's very likely to target $18700 next week. Additionally, the Nikkei has crossed above the 50 periods EMA which is another bullish signal for buyers. Lastly, the 12 periods RSI is also holding in the buying zone, strengthening the bullish sentiment.
Forex Trading Signal
At the moment, we need to wait a bit for the prices to come lower, to $18500, before entering any fresh trades. Perhaps, we will share a buying signal tomorrow, so stay tuned for updates.
- Check out our free forex signals
- Follow the top economic events on FX Leaders economic calendar
- Trade better, discover more Forex Trading Strategies
- Open a FREE Trading Account
Related Articles


Comments
Sidebar rates
Related Posts
