Forex Signals Brief for June 1st – Top 7 Economic Events To Watch Today
Welcome to a new trading month. Though the month of May was a really busy month with a lot of startling economic events, these macroeconomic economic events were not surprising enough to define proper trends. Nevertheless, the geopolitical tensions played their role.
The story began with the geopolitical problems between the United States, North Korea, and Syria. Additionally, the echoes of the French Presidential elections gave us another reason to trade the market. However, the market failed to fill the gaps in the forex, equity and bullion markets.
Yesterday, the buck suffered its biggest monthly drop in four months against peer currencies. The major loss was against the single currency Euro.
Top 7 Economic Events To Watch Today
EUR
- Spanish Manufacturing PMI (7:15)
GBP
- Manufacturing PMI (8:30)
USD
- ADP Non-Farm Employment Change (12:15)
- Unemployment Claims (12:30)
- Revised Nonfarm Productivity q/q (12:30)
- ISM Manufacturing PMI (14:00)
- Crude Oil Inventories (15:00)
EUR/USD – Bulls Dominated Currency Pair
The single currency continued to trade higher against the U.S. dollar despite the unfavorable fundamentals. In particular, the Eurozone unemployment rate sank to 9.3% in the month of April from 9.4% in March. Whereas, the Eurozone flash inflation figures decreased to 1.4% in May from 1.9% in April.
Logically, the Euro was supposed to get weaker, then cause the bullishness in the EUR/USD.
Actually, it was the U.S. dollar which showed more weakness than Euro. For the U.S. dollar, the bearish trend was initiated after the economic reports showed instability in both the U.S. manufacturing and housing sector.
Forex Trading Signal – Idea
Today I'm looking at $1.1260 to trade the EUR/USD. The rough idea is to have a sell position below this level to target $1.1212. However, above this level, we may experience further buying momentum in the pair.
 EUR/USD – Hourly Chart
Technical Outlook- Intraday
We can see a dramatic trendline breakout on the upside of the 4-hour chart of EUR/USD. It's the same level ($1.1190), about which I discussed in the previous update Forex Signals Brief for May 31st. Though it gave us selling, the losses in the pair remained limited and the pair reversed upon the release of damaging economic events from the U.S.
That's the major reason we always recommend following proper money management to avoid sudden reversals. That's exactly happened with our Forex Trading Signal on the WTI Crude Oil. It stopped out despite floating in profit for more than 15 pips.
Regardless, the current situation of the EUR/USD is overbought, which means that sellers are looming around the immediate resistance level of $1.1260. Consequently, the major can take a dip to complete the 38.2% Fibonacci retracement at $1.1215 and even 61.8% at retracement $1.1198.
Support Resistance
1.1137 1.1255
1.1094 1.1310
1.1029 1.1353
USD/JPY – Double Bottomed Currency Pair
The Japanese Yen wasn't really in focus yesterday. That is why it remained range bound with a lower range of $110.490 and an upper range of $111.215.
Investors kept an eye on the Ministry of Finance data which showed an increased capital flow into Japanese bonds last week. Higher investment in the bonds results in weakness in the currency. The exchange of money against the bonds increases the money supply in the market.
The BOJ is likely to hold its upcoming policy meeting on June 15-16. Personally, I'm not expecting any changes, meaning, the USD/JPY is likely to trade neutral and will fluctuate if there are fresh fundamental reasons.
Forex Trading Signal – Idea
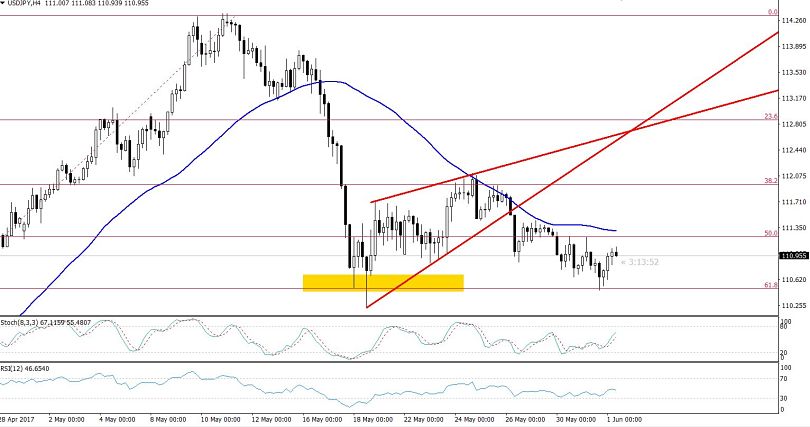
On Wednesday, the Japanese Yen has traded exactly as discussed in Forex Signals Brief for May 31st. Once again, I'm eyeing the $111.350, perhaps it can give us our sell trade.
 USD/JPY – 4 Hour Chart
Technical Outlook – Intraday
In 4-hour chart, the USD/JPY has pulled higher from the 61.8% Fibonacci retracement of $110.450. Aside from Fibo level, the pair has also formed a double bottom support level as it previously pulled back higher on May 18th. The breakage below $110.450 level is likely to add further room for selling until $110.050.
At the moment, the pair is trading below a 50- periods moving average, which is extending a strong resistance at $111.375. The prices below moving average reveal that investors are more interested in keeping the USD/JPY in selling.
Support Resistance
110.74 111.400
110.16 111.950
109.47 112.350
Ending Remarks
Unlike yesterday, today we are expecting heavy trading volumes after the release of ADP Non-Farm Employment Change at 12:15 (GMT) and Unemployment Claims due at 12:30 (GMT) from the United States. We may even have a trade in WTI Crude Oil in the New York session or even before after the release of Crude Oil Inventories at 15:00 today. We will keep you posted, stay tuned!
- Check out our free forex signals
- Follow the top economic events on FX Leaders economic calendar
- Trade better, discover more Forex Trading Strategies
- Open a FREE Trading Account
.jpg)


