WTI Crude Oil – Get Ready To Trade Symmetric Triangle Pattern


In the Asian session, the WTI Crude Oil traded slightly bearish at $47.16 It went down nearly -0.51% due to the worse than expected economic events from the top oil consumer, the United States. I'm referring to the ISM May non-manufacturing index figure released on Monday. The figure declined to 56.9 for the month of May from 57.5, in the previous month.
More importantly, the new factory orders fell to 57.7 from 63.2, the previous figure. Whereas, the business activity/production index also dropped to 60.7 from 62.4 the previous month.
As a consequence, the sentiment was that the drop in economic numbers may result in lower demand for crude oil from the top consumer. Thus, the sellers entered the market in the New York session.
In our earlier update, Middle East Uncertainty – How To Trade WTI Crude Oil? we discussed that Saudi Arabia and three other countries accused Qatar of backing terrorism and consequently cut their relations with the Qatar. As a result, uncertainty has spread in the Middle East and investors hiked their demand for crude oil due to the uncertainty.
Forex Trading Signal – Idea
I'm eyeing the $46.95 trading level for a sell position, and below this level aim to target $46.75/65. While above $46.95, the oil has the potential to target $47.35.
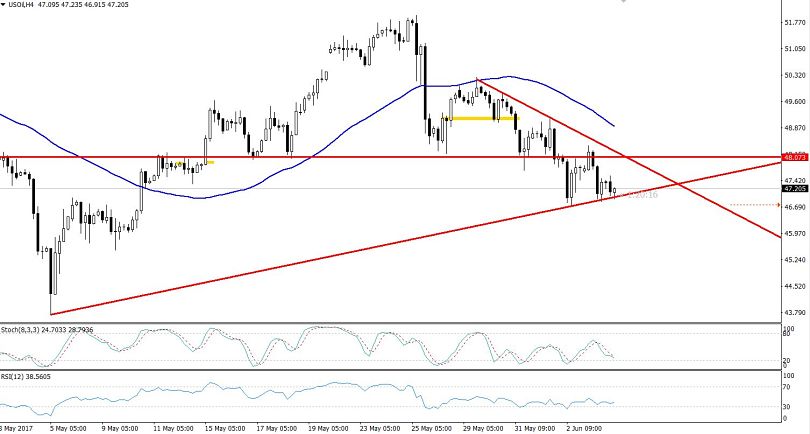
4-Hour Chart WTI Crude Oil – Symmetric Triangle Pattern
Technical Outlook – Intraday
Our previous Forex Trading Signal on the Crude Oil proved a good idea. At the moment, the WTI Crude Oil is trading at the lower bottom of the range, testing $46.95, a solid support level.
Let me draw your attention towards the Symmetrical Triangle pattern in the 4-hour chart, which is extending a significant support at $46.95 and resistance at $48.
Undoubtedly, taking a buying position here is worth the risk. However, the momentum indicators aren't supporting the buying sentiment as the RSI is holding below 50, in the selling zone. Let's wait for the instant entry. Stay updated as we are likely to share a trade signal on oil during the European session.