Symmetric Triangle Pattern – Get Ready To Trade Gold!


The precious metal gold has gained for the 3rd consecutive trading day. It has added more than 100 points to trade at $1251. The Bulls have appeared mainly due to the slump in the greenback seeing as it has fallen to the 8- month lows.
It has triggered the demand for dollar-denominated gold as the investors are uncertain about why the Senate delayed the vote on Trump's new healthcare bill that would essentially replace Obamacare. The combination of a softer buck and dipping equity markets underpinned the precious metal.
Today, investors are focusing on the gross domestic product and unemployment claims which are due to be released by the United States at 12:30 (GMT). We can expect a volatile session ahead.
Forex Trading Signal – Idea
Considering the technical side, the idea is to have a sell position below $1249 with a stop loss above $1254 and a take profit of $1245.
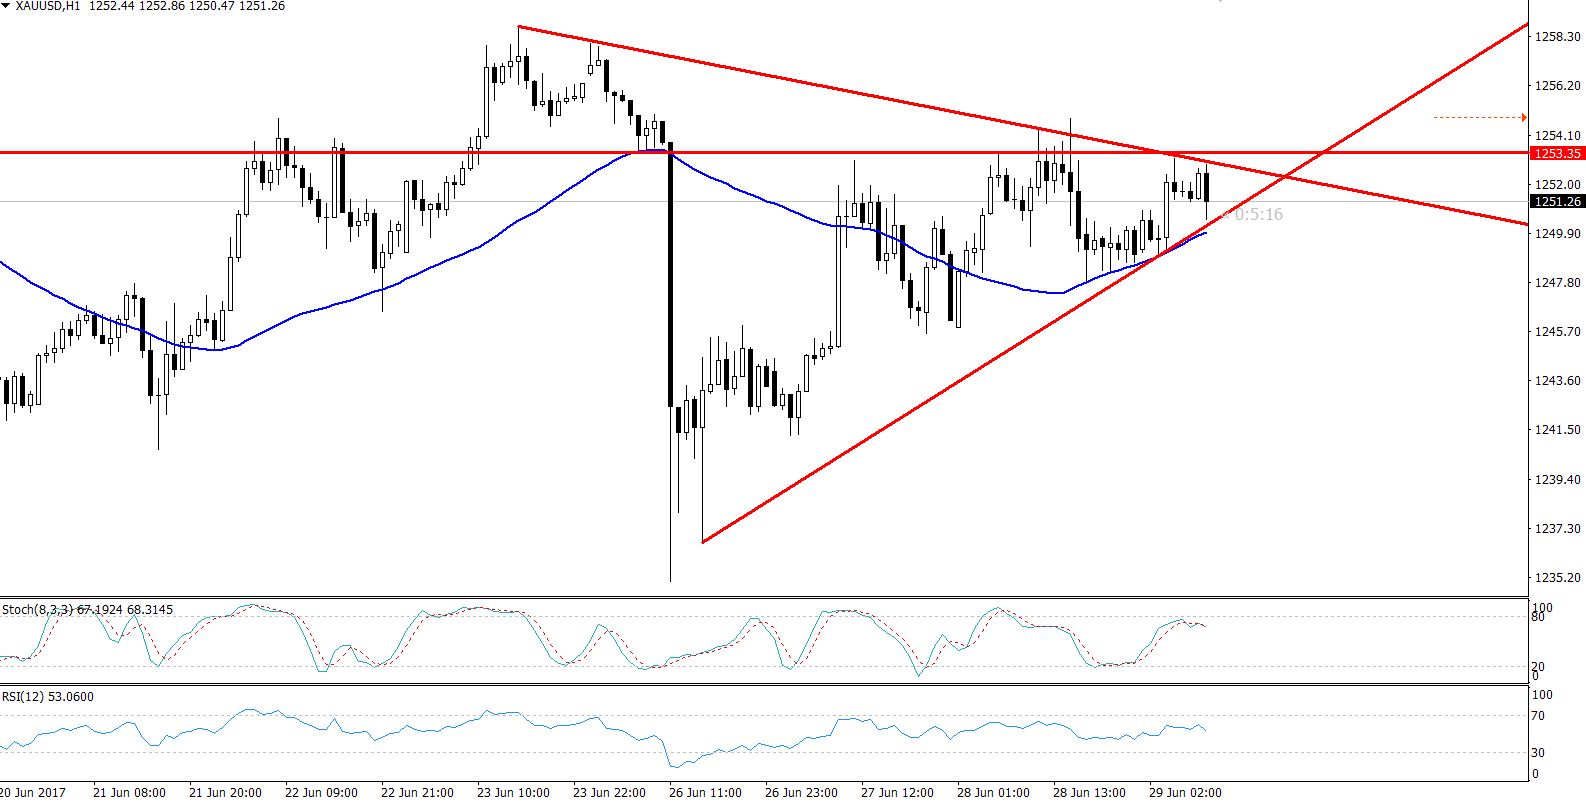
Gold – Hourly Chart – Triangle Pattern
Technical Outlook – Intraday
Focusing on the hourly chart, we can see a symmetric triangle pattern. It's extending a solid support at $1249 and the breakage is likely to push it lower, towards $1245.
The RSI & Stochastic are suggesting traders' bearish bias. On the hourly chart, 50 periods EMA is extending a strong resistance at $1252. The upside crossover is likely to likely to add further room for buying until $1256.