One Level Gone In Gold, One More To Go
Yesterday I posted an update about Gold in the evening. Gold was facing resistance around $1136 where the 200 SMA (purple) was standing on the daily chart and stochastic was overbought, so there was a possibility that a retrace evolved before the break higher.
Well, it didn´t happen. Fast forward 24 hours and Gold is now nearly 10 cents higher and the 200 moving average is history. The 100 smooth moving average (red) is also broken.
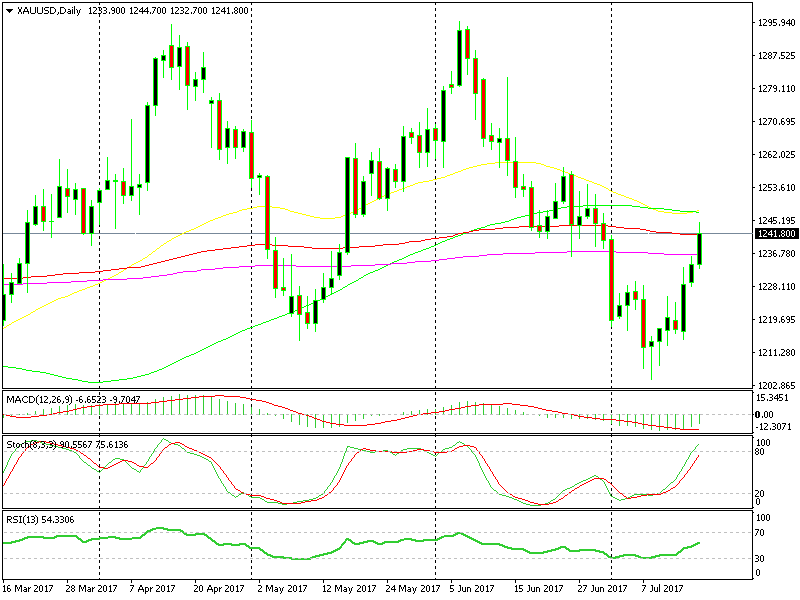 Yesterday´s obstacles are gone
But there are more obstacles to the upside. The 50 and 100 simple moving averages still stand on the way at $1247, so gold bulls have to take them out first before thinking of moving any higher.
But before we even get there, there´s the 200 SMA on the H4 Gold chart which comes at 1243.50. The previous hourly candlestick closed as a morning star, while the last one looks like is going to close as an upside-down pin, both of which are reversing indicators.
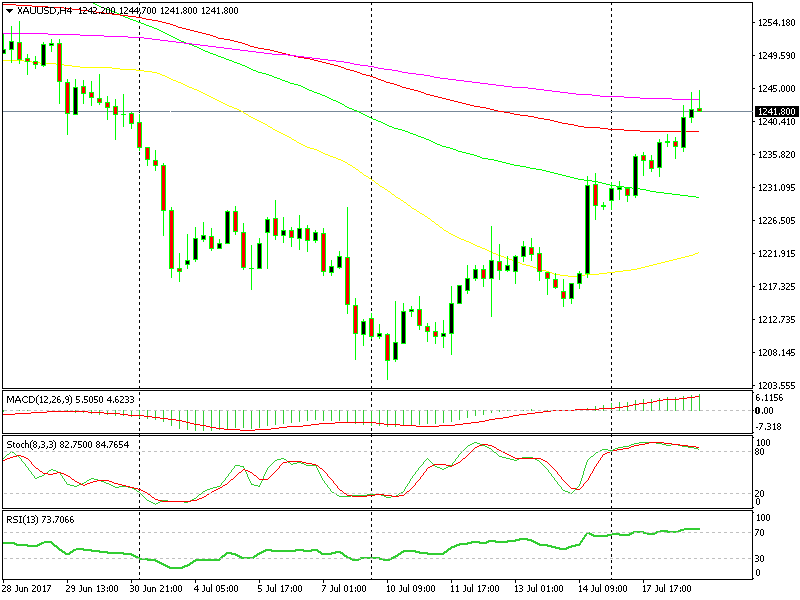 The last 2 candlesticks look pretty bearish
From the technical point of view, the uptrend might have stretched a bit too far for the time being and a retrace might be on the way, but fundamentally the USD is still under pressure. The US politics are unclear at the moment and with the fiscal plan coming up I think they will get worse, but I will cover that story tomorrow, so check us back, folks.
- Check out our free forex signals
- Follow the top economic events on FX Leaders economic calendar
- Trade better, discover more Forex Trading Strategies
- Open a FREE Trading Account
- Read our latest reviews on: Avatrade, Exness, HFM and XM
Related Articles


Sidebar rates
Related Posts
