What’s Next For EUR/USD?
It seems the big levels at 1.15 and 1.16 are gone for good now. Although, until we move close to 1.17, 1.16 can´t be considered gone.
The 100 SMA (red) is waiting around there as well on the weekly forex chart and we might dive below it again. We can´t rule that out unless EUR/USD moves substantially higher.
Technically, this forex pair is overbought in all timeframe charts according to stochastic and RSI indicators, which are generally used to tell when a forex pair is overbought or oversold.
Now the fundamentals have taken over. However, let´s take a look at what stands in the way above these levels because at some point this uptrend will come to an end.
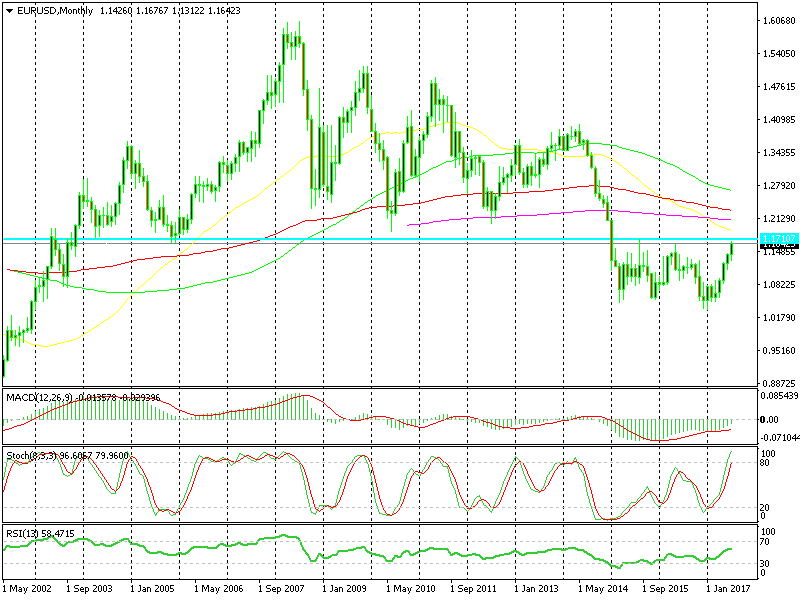
The next decent level of resistance comes at 1.1715
First, comes the high from two years ago when the Chinese stock exchange saw some heavy selling in just a few days and panic set in. It comes in at 1.1715 according to my broker´s platform making that the first decent resistance level.
Above that, is the 50 SMA (yellow) at 1.1890. The resistance area stretches all the way to 1.19, but don’t rule out spikes to clear out weak stops above.
Then, there is the 200 SMA (purple) which has provided solid support many times when EUR/USD was trading in a wide range between 1.20 and 1.40-50. That´s supposed to turn into resistance now. It is waiting at the bottom of that range and that will be the ultimate resistance. But, there are 500 pips standing between here and there, so it will take time if it does indeed happen.
- Check out our free forex signals
- Follow the top economic events on FX Leaders economic calendar
- Trade better, discover more Forex Trading Strategies
- Open a FREE Trading Account
- Read our latest reviews on: Avatrade, Exness, HFM and XM
Related Articles


Sidebar rates
Related Posts
