Ascending Triangle Breakout – Black Crack Bulls


Black Crack seems to be shifting trends after coming out of a well-maintained trading range of $42 – $47. Now, it has formed another range from $47 – $49 due to consistent draws in the crude oil inventories report. For more on how to trade the news, feel free to refer to our FX Leaders article on news trading, especially if you are looking for scaling.
Talking about fundamentals, the crude oil is still trading bullish due to the fresh inventories. Energy Information Administration (EIA) data recorded an inventory draw of 7.21 million barrels followed by a draw of 4.7 million barrels last week.
 Crude Oil – 4-Hour Chart – Ascending Triangle Breakout
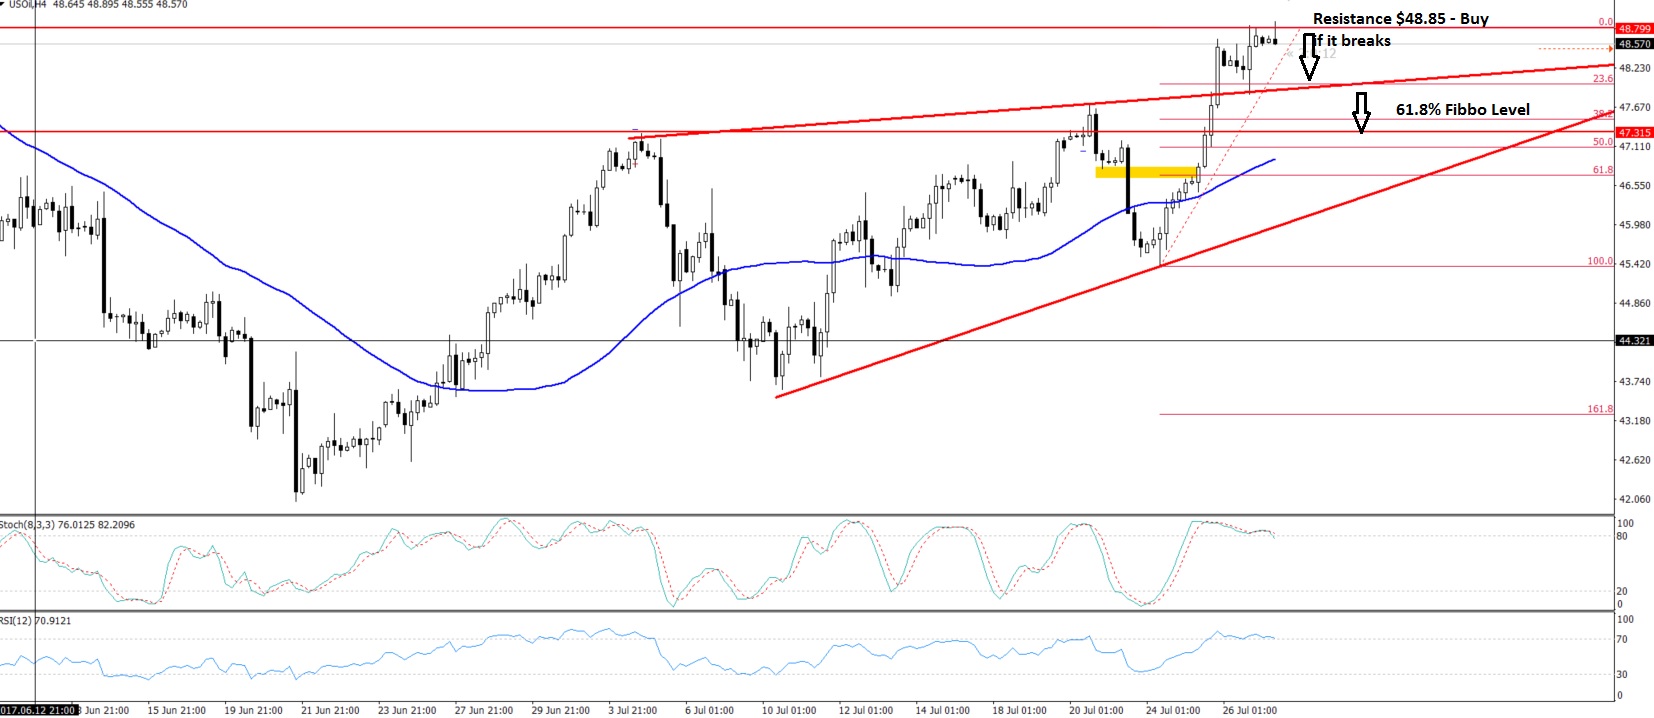
Technically, the energy instrument has an immediate support at $48.55. Above this, the oil has the potential to hit $49.10. On the daily chart, we can see two solid bullish candles, which is showing that the bulls are dominating over the bears. We can also see that the oil has broken above an ascending triangle pattern which was providing solid resistance at $47.60. This means that the oil has a high probability of targeting $49.40 soon.
WTI Crude Oil Trading Plan
At this moment, I'm not seeing any trade in the crude oil since the prices are in between the upper and lower range. Nevertheless, $47.55 is a potential buying level. Let's wait and see what happens!