Gold And Economic Data Go Hand In Hand, Until They Don’t Anymore


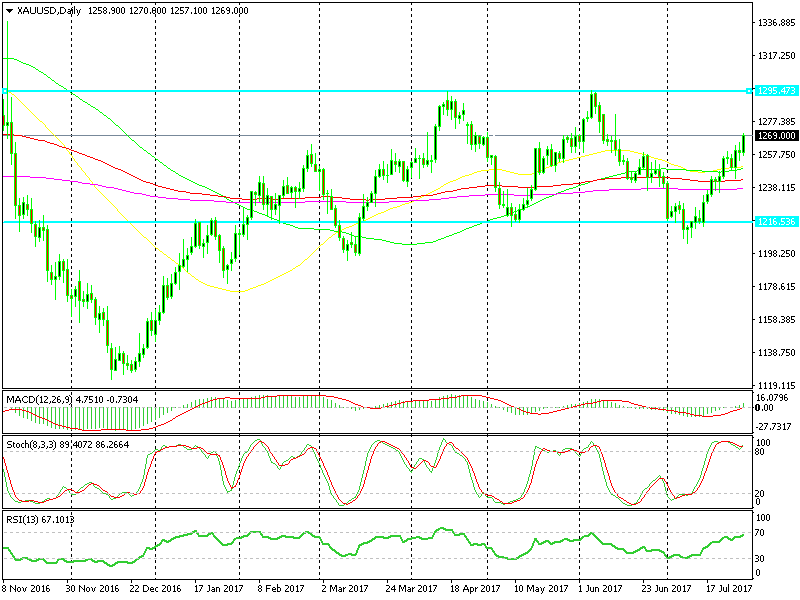
Gold is so trendy, we know that and this year´s Gold daily chart shows that clearly. Starting from January, Gold climbed for about 2 months until the end of February, then it reversed back down for the next 2 weeks.
Since then it has been going up and down every month. The last decline started at the beginning of June which ended early this month and during the entire month of July Gold has only climbed higher.
 Are we going to reach the top of the range soon?
It looked like it was going to reverse back down this week after forming a doji on Monday and losing $13 in the next several trading sessions, but no, today´s US GDP report gave Gold another strong push higher.
There were 3 reasons in that report which activated Gold bulls today:
- Lower inflation
- Lower earnings
- The market was expecting a better GDP reading due to higher inventories this week
So, the data went in favour of the latest Gold uptrend which started earlier this month. You´d be surprised how often the data coincides with the trend and the bigger levels, but that what has happened today and it happens pretty often.
I bet that when Gold reaches the top of the range around $1,295-6 we will have a data release which will be positive for the market sentiment and USD and negative for Gold. That would be the perfect time to sell Gold, but we have to wait a few more days until then.