Forex Signals US Session Brief, August 8th – USD Entering The US Session Quietly


The USD Is On The Defensive
The price action and chart formations on the hourly forex chart, are just pure noise compared to last week's, but those are our trading options until August ends.
Following Friday's 100-120 pips surge due to the positive US economic numbers, the USD started retreating. Today it's pulling back even more. Although, looking at the bigger picture, this looks more like a consolidation.
We have no choice though. Regardless of the pull back we have to trade the smaller time frames until the forex market wakes up. In these time frames, the retrace is more visible, particularly in USD/JPY, which is gaining some momentum.
This seems to be a bad day all around. Even USD/CAD which has seen an uptrend over the last week and gained around 3 cents, is retracing lower today.
By the way, there´s a trade setup forming in this forex pair, but we will have another look at it later when the setup is formed. Check back in a couple of hours to find out about the trade here.
 Hopefully, US traders will provide some action for bored traders

Is USD/JPY Still Trending Down?
After the 120 pips jump on Friday, we thought that the downtrend in USD/JPY might have finally come to an end after sliding down for most of July and losing nearly 5 cents. The big level at 110 and its buffer zone (20 pips north and south) held pretty well after several attempts to break below it last week.
But the road is not clear for USD/JPY buyers yet; the pair turned around today after consolidating all day yesterday and the top level of the buffer zone at 110.20-30 is now under attack. Judging from the price action, I think that this level will soon go since the bounces higher have been very minimal today.
The question is whether the 10 level will be broken as well and this pair will resume the downtrend or whether the 110 holds and the trend changes.
Trade Idea: The trade would be to go long around 110 with a stop below 109.70, trying to catch a decent bounce. Alternatively, if the price breaks below 110 I would go with the break though not immediately. I would wait for a retrace to 110 and then sell if the buyers can´t push any higher, so hang around for a signal on this pair.
If 110 breaks, the next target is 109. However, everyone would be eyeing 108, which has been the low so far this year, meaning a break below 110 might open a door for 108. That could mean a 150-200 pip target for those who are willing to sell.
AUD/USD Downtrend Continues And We´re Trying To Get Some Pips
AUD/USD has also been sliding over last week, after a solid uptrend in the last month. It has lost more than 150 pips since it peaked at 0.8066 the Friday before and has formed a downtrend as you can see on the hourly forex chart below.
Yesterday the sellers had another go at the downside, but it doesn’t count as another leg of the downtrend since it didn’t break Monday´s low. Also, the 200 SMA (purple) on the H1 chart held up pretty well so that has to go as well if the downtrend is to extend further below.
As the retrace was evolving today, we decided to open a sell forex signal here because I noticed the buyers having trouble around 0.7940.
Seems like we´re heading for take profit in no time
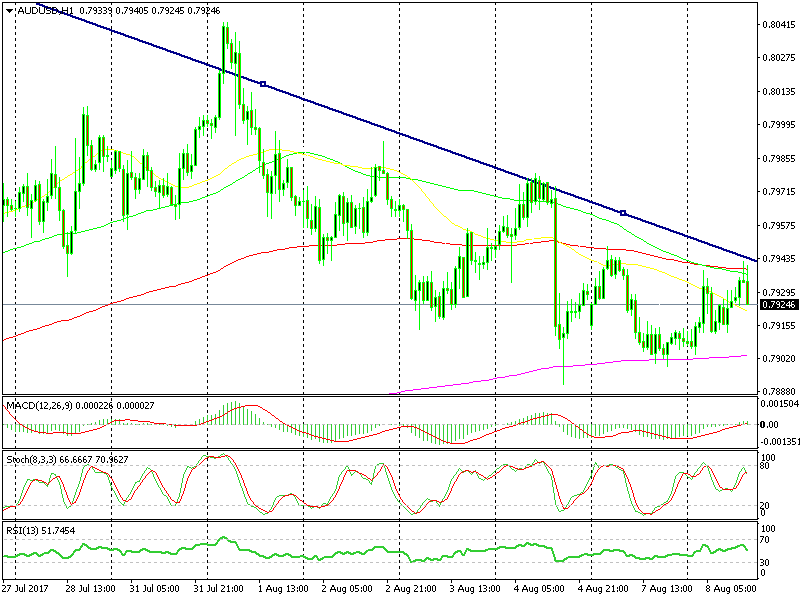
Do you see the upside down pin which was formed in the previous hourly candlestick?
That´s a signal that the buyers might have had enough and we´re likely to see a reverse take place soon. The stochastic indicator is overbought as well, which is another selling signal.
That´s not all though; we have the 100 simple (green) and smooth (red) moving averages which are holding above where the price is now. They´re scaring the buyers off and the ascending trend line higher up is adding strength to these moving averages.
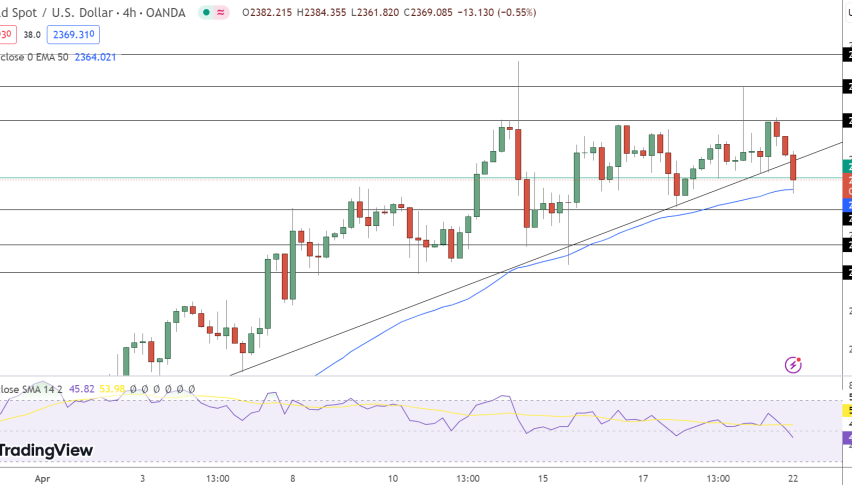
We decided to open that signal, although the H4 chart is still headed up. Stochastic is not overbought yet, although the buyers don’t seem to have the stamina to push higher. If that would be the case, then the 500 SMA on the H4 chart will be the next major obstacle to overcome.
At the moment, our signal looks good and we hope that the US traders take the upper hand when they enter the market in a few minutes, giving us some action to trade after another very boring morning.