Contradiction in EUR/USD Between The H1 and H4 Charts
If you watch the hourly EUR/USD chart, you can see that it is oversold since the stochastic indicator is oversold. The price has been slidi
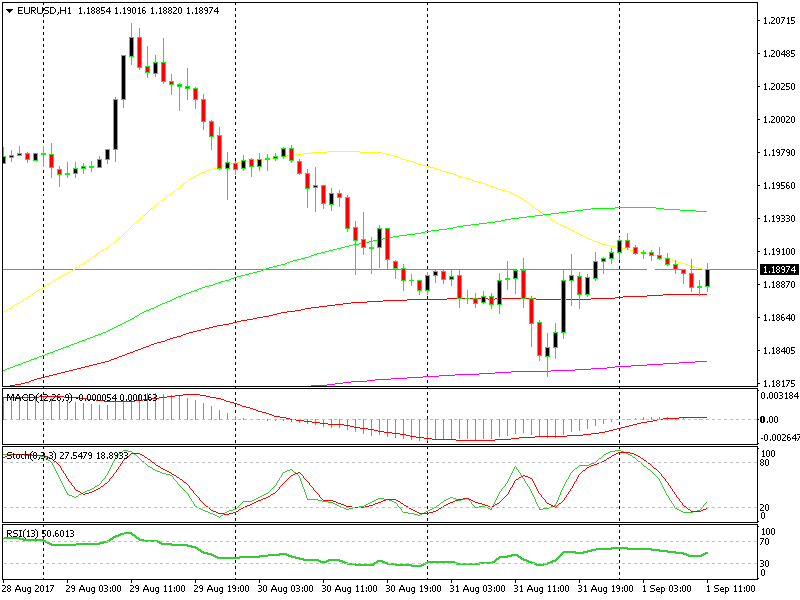
If you watch the hourly EUR/USD chart, you can see that it is oversold since the stochastic indicator is oversold. The price has been sliding in the last few days after it broke some forex accounts when it moved above 1.20 for a short period.
 The 100 SMA is providing support today
Although, yesterday the price stalled right at the 200 SMA (purple) on the H1 chart around 1.1820. That level coincides with the 20 SMA on the daily forex chart, which makes it a strong support level and the price did bounce yesterday off it.
It climbed all afternoon yesterday and this morning it has retraced lower to the 10 SMA (red) while stochastic has become oversold.
The last hourly candlestick formed a doji which is a reversing signal, so this chart is now pointing up and the price is moving higher indeed.
The H4 chart on the other hand is pointing down. Despite the bigger uptrend, this week EUR/USD has been trading lower so the trend is down this week and yesterday’s move higher looks to be just a retrace.
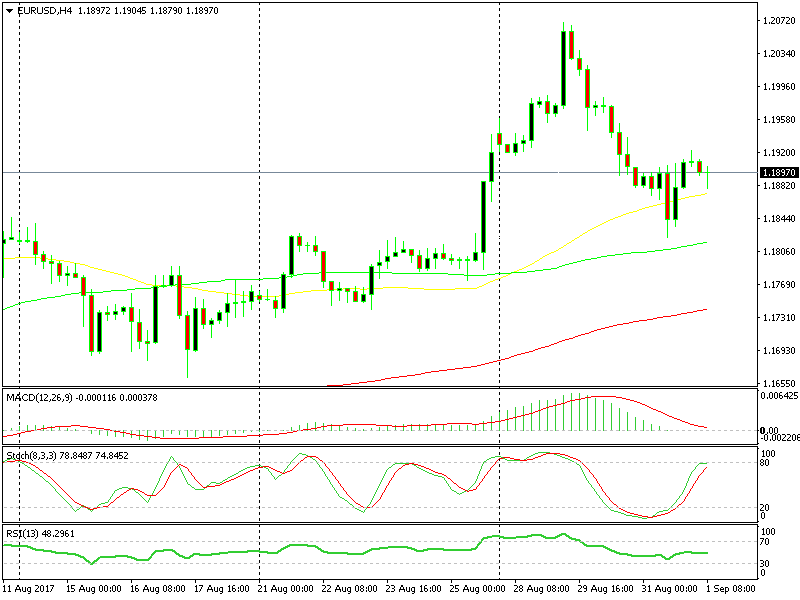
The H4 chart is already overbought
The candlestick which closed at 4 Am this morning formed a doji which is another reversing signal but this time it points in the other direction, down.
So, both time frame charts are contradicting each other. In this case, I wouldn’t pick a side, at least not until the US employment report is published later today, so let´s have a look at the other pairs to see if there are any trade setups for us.
- Check out our free forex signals
- Follow the top economic events on FX Leaders economic calendar
- Trade better, discover more Forex Trading Strategies
- Open a FREE Trading Account
Related Articles


Comments
Sidebar rates
Related Posts
