Triple Top Pattern – Buckle Up For Next Trade?


The Japanese stock market index surged sharply during the Asian sessions. Unfortunately, we were not able to get in the market. No worries, I can see another potential trade. Get set for it.
Nikkei – Quick Trade Setup
We can see on the 4- hour time frame of Nikkei is surging sharply to retest the triple top level of $20,090 and has closed below the same level. The leading indicators are suggesting that the Nikkei is overbought, it should compete for the 23.6% retracement at $20020 and 38.2% retracement at $19,980 in the hourly timeframe.
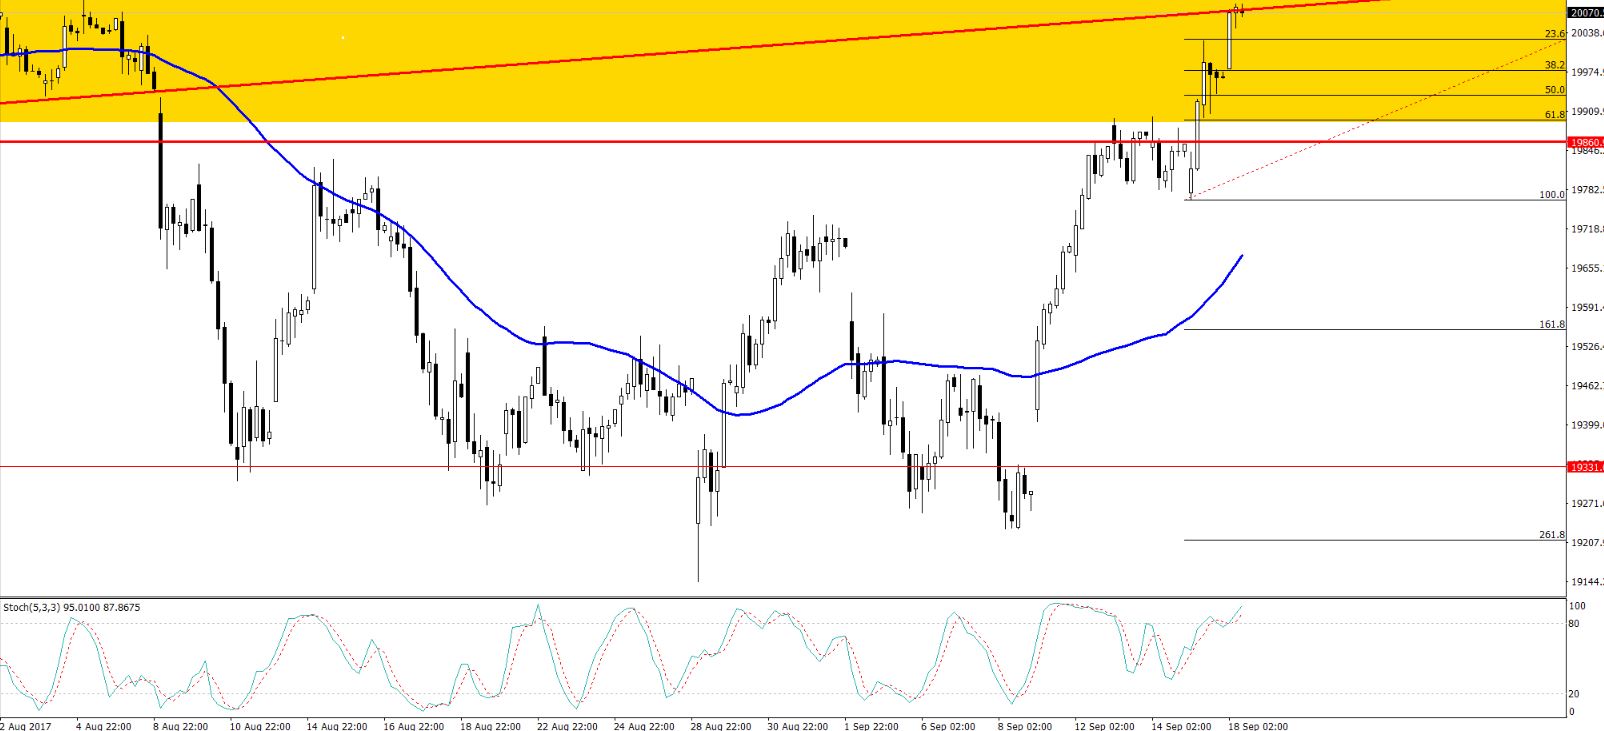 Nikkei – 4 Hours Chart – Triple Top
We can see a candlestick pattern hanging man level followed by bullish candles, which signifies the bearish reversal. It means the bulls are getting weaker, and we may see seller's entering the market soon. The 50- periods moving average is left far behind at $19,650, and a definite signal that the price needs to come down to the technical levels.
Nikkei – Trading Idea
I'm placing my sell limit at $20,150 with a stop above $20,200 and take profit at $19,975. Good luck.