Sell Entry In Nikkei – Double Top Pattern In Action!


Yesterday, our trading signal on Nikkei floated in +60 profit, but unfortunately, the market reversed overnight to close our signal at the stop. That's why it's always recommended to move stops at breakeven once our position is in profit.
Quick Technical Outlook
On the 4- hour chart, we can see the overbought Nikkei has started coming out of the overbought zone. The triple top pattern on the daily chart is providing a solid resistance to the Japanese Stock Market Index at $20,300.
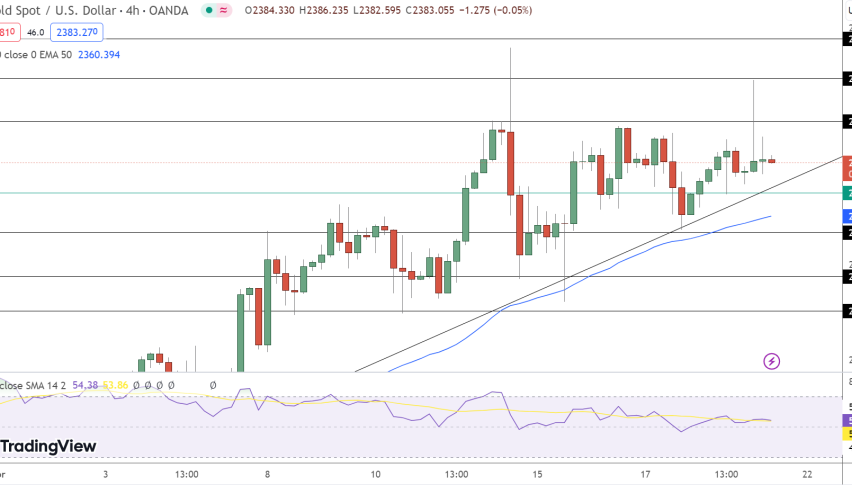
 Nikkei – 4 Hour Chart – Sell Entry
The leading indicator RSI Nikkei is coming out of the overbought zone, and it's very likely that Nikkei will keep the bearish momentum to complete the 38.2% retracement at $20,098 in the 4-hour timeframe.
Nikkei – Trading Idea
I'm sticking with the same plan to stay in sell position below $20,275 with a stop loss above $20,350 and take profit at $20,100. We need to monitor the Federal Open Market Committee today as this may also impact the global stock markets.