Descending Triangle Pattern In EURJPY – What to Expect?
On Monday, the market usually lacks volatility and shows sideways movements. But today, the scenario is a bit different. It's nonfarm payro
On Monday, the market usually lacks volatility and shows sideways movements. But today, the scenario is a bit different. It's nonfarm payroll (NFP) week my friends, and the market is pricing in the forecast of U.S. labor market figures. Considering the uncertainty related to USD pairs, we have an option to position our investments into cross currency pairs. Let's take a look at EURJPY.
Technical Overview – EURJPY
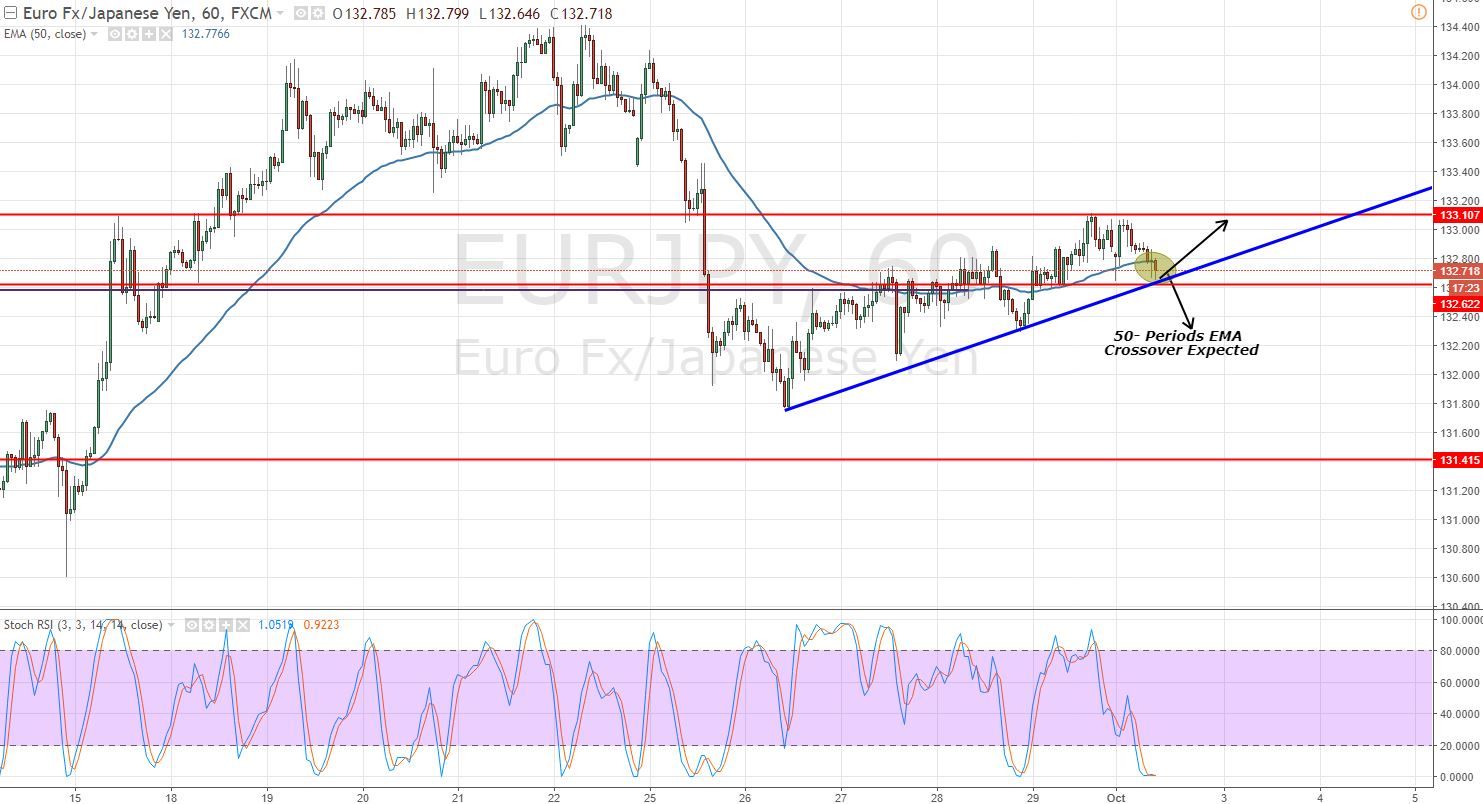
Looking at 4-hour chart, we can clearly see a formation of ascending triangle pattern which is supporting the pair at $132.500. At the moment, the pair is trading at $132.680, right above the bullish trendline.
 EURJPY – Ascending Triangle Pattern
 EURJPY – Ascending Triangle Pattern
 On the same chart, the pair is struggling to cross the 50- periods EMA at $1.32.700 on the bearish side. However, the crossover will be confirmed once the pair closes at least two candles below the moving average. Now, the point is if EURJPY will exhibit a moving average crossover, or it will pull back upward. Well, only time will tell. Take a look at the intra-day support and resistance levels for EURJPY.
Support Resistance
132.44 133.07
132.24 133.27
131.92 133.58
Key Trading Level: 132.75
EURJPY – Trading Plan
I'm looking at the $132.950 to stay in sell below it with with a stop above $133.250 and a take profit at $132.35. Good luck!
- Check out our free forex signals
- Follow the top economic events on FX Leaders economic calendar
- Trade better, discover more Forex Trading Strategies
- Open a FREE Trading Account
Related Articles


Comments
Sidebar rates
Related Posts
