In our previous update WTI Crude Oil – Head & Shoulder Pattern In Action, we discussed the bearish pattern. But now, the Crude Oil is likely to remain supported as the major economy China is back from week-long holidays. This is how I'm planning my trade.
Technical Outlook
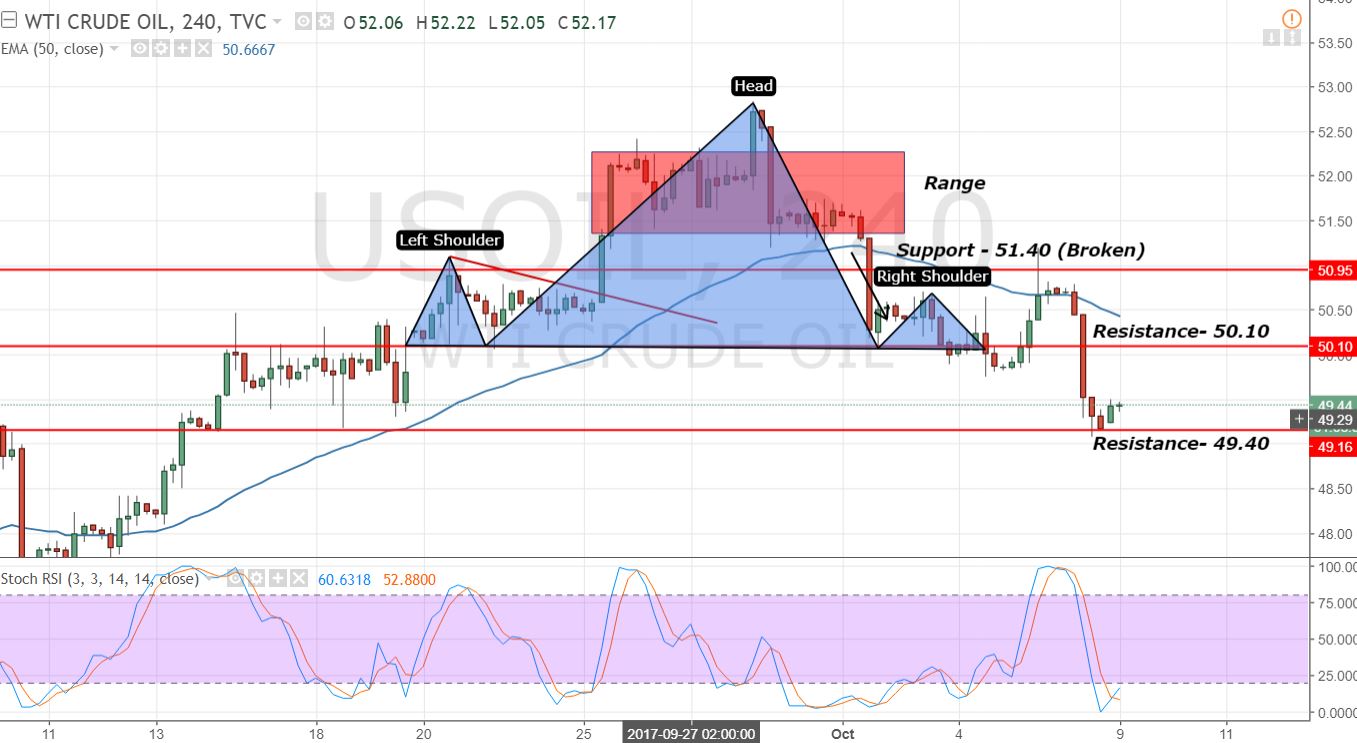
On the 4-hour chart, the Crude Oil has dropped below the major support level of $50.10. It hit another support level of $49.10, that's the same level recommended in our previous update.
 Crude Oil – 4- Hour Chart – Fibonacci Retracement
 Crude Oil – 4- Hour Chart – Fibonacci Retracement
 For the moment, the Crude Oil has gone oversold and it's very likely to retrace back above $49.10. I just applied a Fibonacci retracement indicator on the 4- hour chart. The 23.6% retracement falls at $49.60 while 32.85% retracements stays at $49.91. For all the newbies out there, you should check out FX Leaders Fibonacci Trading Strategy to understand the Fibonacci trading skills.
Crude Oil -Trading Plan
I'm eyeing $49.10 to enter buying with a stop loss below $48.85 to target $49.60 and $49.85. On the flip side, below $49.95, we can take a sell position. Keep following us as we will keep you posted about further updates on it. Good luck!