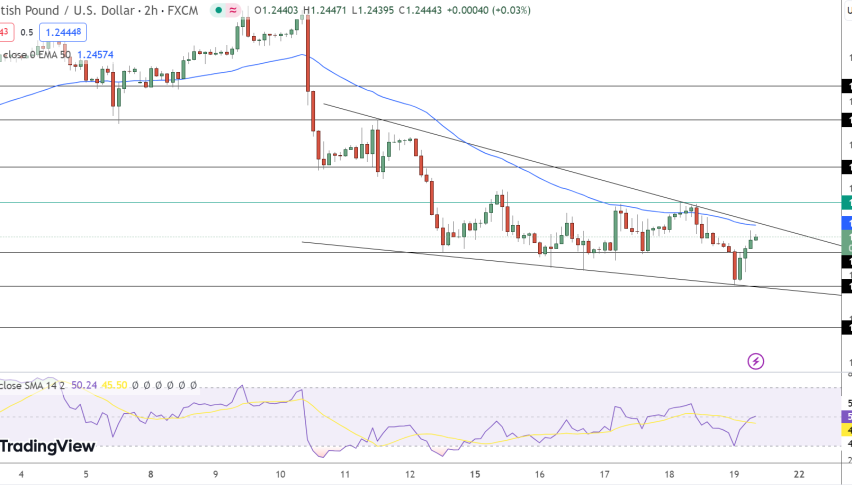
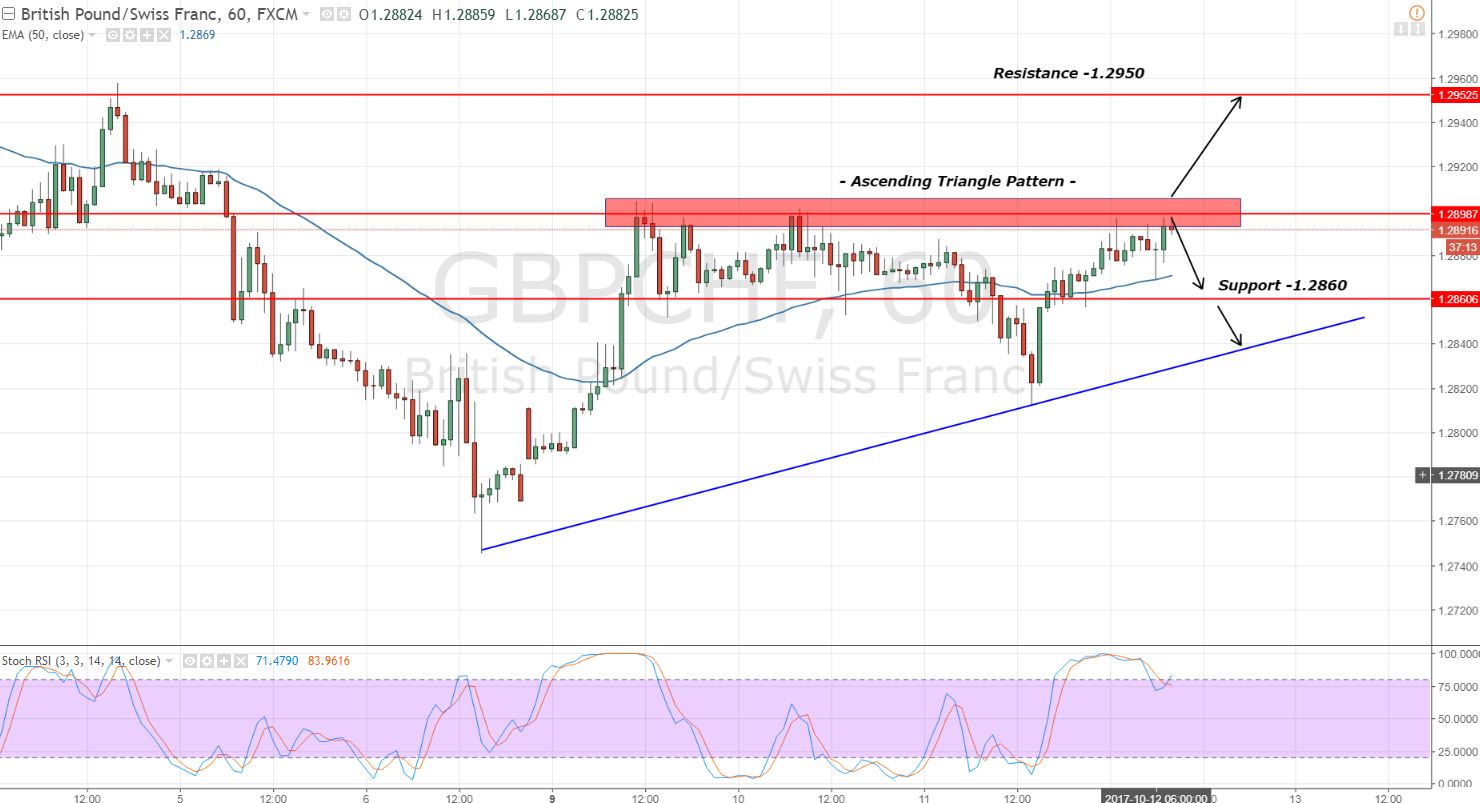
GBPCHF – Get Ready to Trade an Ascending Triangle Pattern


The Asian session remained quite boring and now the European session is also lacking volatility as the investors await U.S. session to trade the news. Anyhow, the technical side of GBPCHF is signaling a trade setup. Let's check this out…
Key Technical Points:
On the hourly chart, the GBPCHF is consolidating in the ascending triangle pattern. The triangle is providing a resistance at $1.2900. The GBPCHF is going to test this level for the third time now.
 GBPCHF – Hourly Chart – Ascending Triangle Pattern
 GBPCHF – Hourly Chart – Ascending Triangle Pattern
Historically, the ascending triangle patterns are supposed to breakout on the upper side. Looking at the Stochastics and RSI, both of them are holding above 80 which is resisting me to enter the buy position now. Lastly, the 50- periods EMA is suggesting a bullish trend of the pair and it's also supporting the pair at $1.2865.
GBPJPY – Trading Idea
Considering the technicals, the buy positions are preferred on the breakage of $1.2900 with a target of $1.2945. While below $1.2900, I will do nothing but wait for the pair to test $1.2860 to take a buy position. Good luck!