There’s a Case for the Euro to Rally, but How Far?
EUR/USD failed to break above the 1.21 level after three attempts from buyers about a month ago. After that, it reversed down and it broke the 50 SMA (yellow) on the daily chart, so we thought that the uptrend might have come to an end.
But in the last few days this forex pair has turned back higher and yesterday it broke above that moving average again. The USD went through a moment off weakness after the FOMC minutes and the Euro took advantage of it.
Fundamentally, there are two positive events for EUR/USD. First, there were still a few concerns in the FOMC minutes which don’t help the Dollar and second, the Catalan President Puigdemont left on hold the declaration of independence.
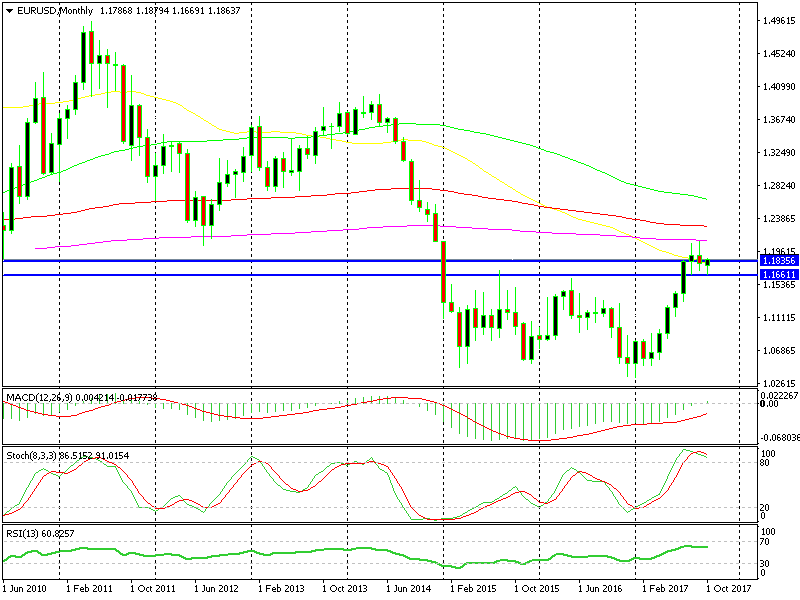
But technically, the Euro is overbought on the daily chart and the monthly chart setup still strongly suggests deep a reversal.
 The monthly chart still looks pretty bearish.
As you see on the monthly EUR/USD chart above, the price is severely overbought and the last two monthly candlesticks look like dojis. Dojis are bearish reversal indicators after an uptrend.
So perhaps, EUR/USD will climb a little higher on fundamentals until it gets close to the 200 SMA (purple). That moving average will provide resistance again and eventually, the price will head down for a decent retrace.
This is a probable scenario based on recent development for both, the Euro and the USD, which make up this pair.


