A while ago we opened a sell forex signal in Gold. I was looking at the H1 Gold chart this morning and saw that this chart was overbought, and the price was turning lower.
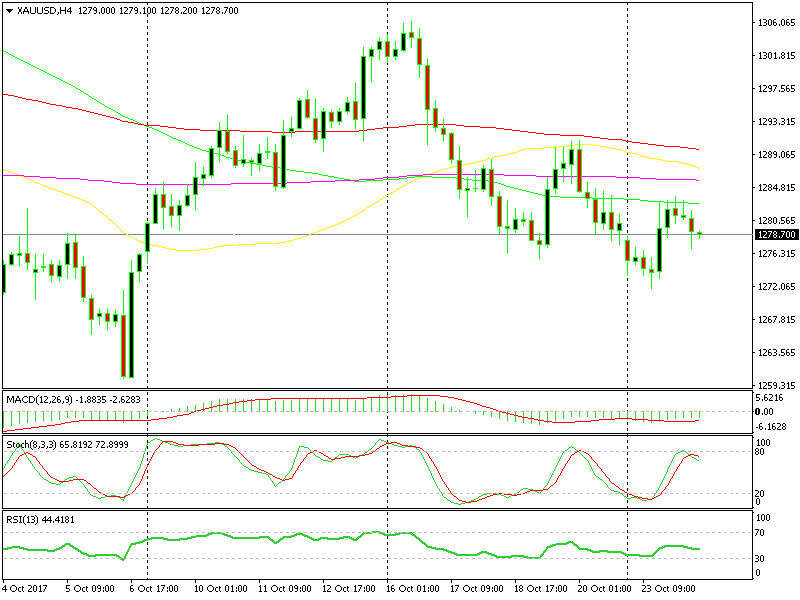
But, it was the H4 chart which convinced me to go short on Gold. As you can see from the chart below, Gold has been trading in a downtrend last week which is part of the bigger downtrend that started in September.
 The 100 SMA provided solid support.
In this timeframe chart, the price had retraced up since the Tokyo session opened on Sunday evening. But, this morning the retrace reached its limits as the stochastic indicator became overbought. Last week, the buyers gave up when the stochastic indicator became overbought, so this meant that the downtrend was about to resume soon.
Another bearish sign was the failure to break above the 100 SMA (green). Gold buyers tried to break this moving average several times but failed.
The last few H4 candlesticks looked also bearish since they closed as dojis or pins. These bearish indicators were more than enough for us, so we opened a sell Gold signal. It looks good at the moment, but let’s give it the time it needs.