How Many Bearish Indicators Can You Spot in This EUR/GBP Chart?
EUR/GBP has traded in an uptrend in the last two years, but last month the situation started to reverse. Although in my opinion, the decidi
EUR/GBP has traded in an uptrend in the last two years, but last month the situation started to reverse. Although in my opinion, the deciding move happened yesterday. The European Central Bank (ECB) started to send the Euro tumbling 200 pips lower, and EUR/GBP tumbled lower with it.
The GBP did lose some ground yesterday as the USD received some bids during all the EUR/USD selling. But, the event was related to the Euro, so the Euro was the one to suffer the most.
EUR/GBP lost about 100 pips in the aftermath, although this morning we saw a retrace higher taking place. This forex pair climbed higher on the hourly chart reaching the 20 SMA (grey) which provided resistance.
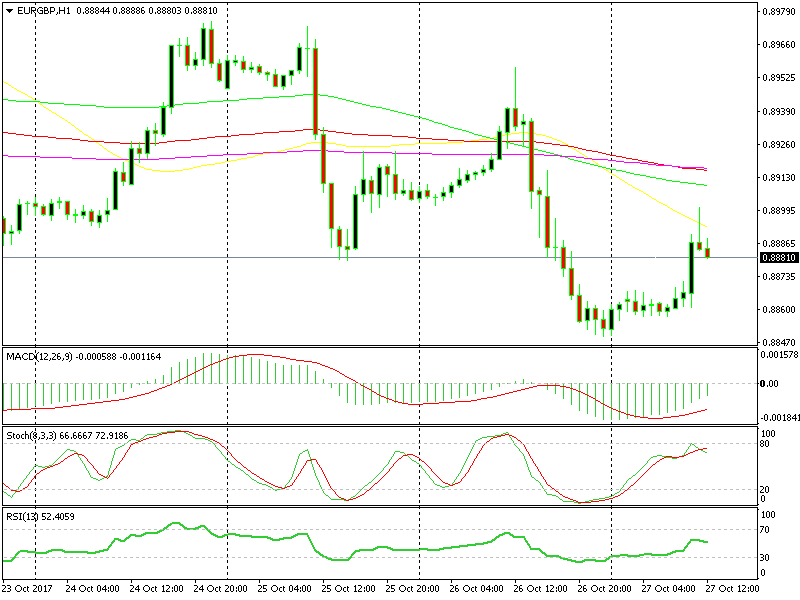 I can spot four bearish technical indicators on the H1 chart.
The stochastic indicator reached overbought levels as well and on top of that, the previous hourly candlestick closed as an upside-down pin. That pin means that a reversal lower is about to follow. So, we decided to go short right then. Anyone else getting in on this trade?
- Check out our free forex signals
- Follow the top economic events on FX Leaders economic calendar
- Trade better, discover more Forex Trading Strategies
- Open a FREE Trading Account
- Read our latest reviews on: Avatrade, Exness, HFM and XM
Related Articles


Sidebar rates
Related Posts
