H4 and Daily Gold Charts Contradicting Each-Other
On Tuesday we opened a sell signal in Gold. Gold was climbing as the USD was being sold off, but the price reached the 100 and 200 smooth m
On Tuesday we opened a sell signal in Gold. Gold was climbing as the USD was being sold off, but the price reached the 100 and 200 smooth moving averages on the H4 chart. Those moving averages have been providing resistance for a few weeks, so we decided to go short just below them.
Gold stopped right at those moving averages for a few sessions, but the USD selloff continued yesterday and Gold broke above them. Although, it didn’t break above last week’s high, despite piercing it for a brief moment.
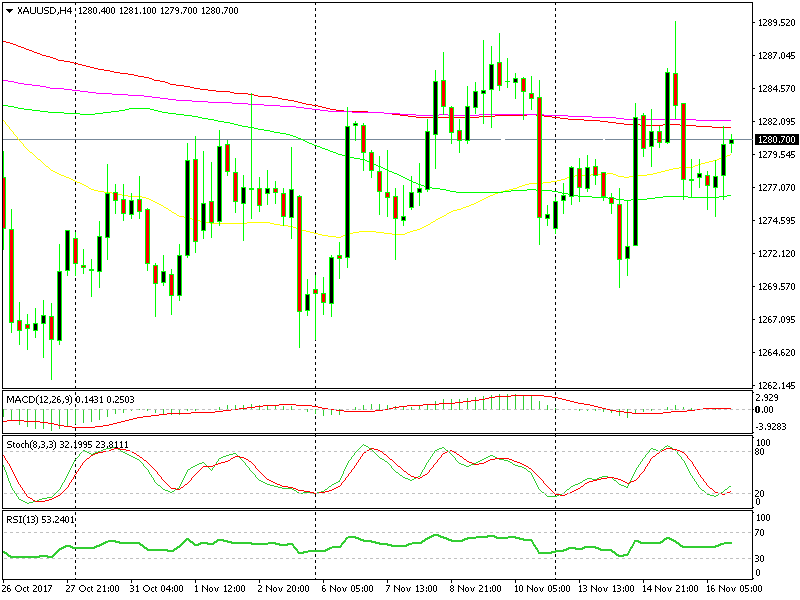
The H4 chart is oversold and turning up
Then, Gold reversed back lower and headed towards the $1,270 level. But, it didn’t quite reach that level and one of the reasons was the 100 SMA (grey) on the H4 chart. It has been providing support in the last few trading sessions and it doesn’t look like it’s letting go. Stochastic is oversold as well on this Gold chart, so the downside doesn’t look too easy.
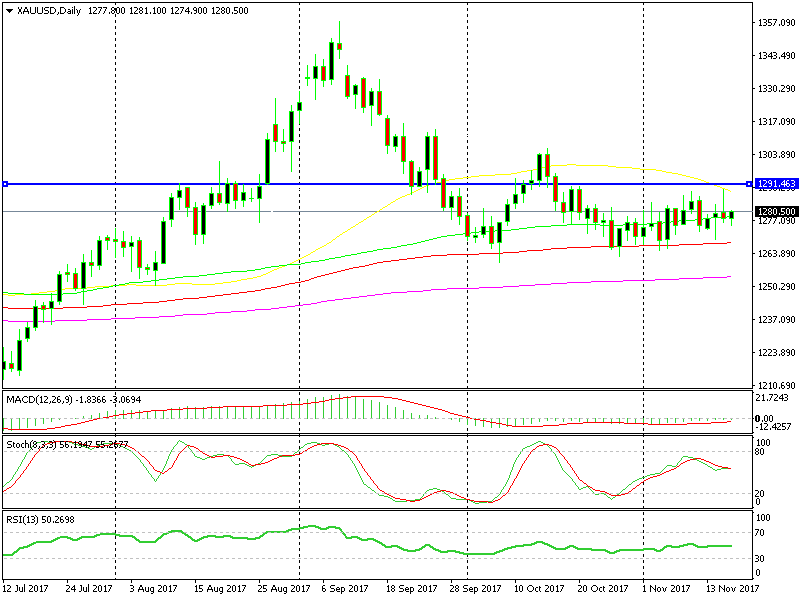
Yesterday’s candlestick looks bearish
On the other hand, the daily chart seems bearish to me. The move yesterday stopped right at the 50 SMA (yellow) which has provided support previously. This time it provided solid resistance with another resistance level just above there.
The price closed as an upside-down hammer, which is a reversing signal after the move higher yesterday. So, it’s a battle between these two charts. No one knows which one might actually win this battle, but our signal here is in profit, so you can lock your trade at breakeven.
- Check out our free forex signals
- Follow the top economic events on FX Leaders economic calendar
- Trade better, discover more Forex Trading Strategies
- Open a FREE Trading Account
- Read our latest reviews on: Avatrade, Exness, HFM and XM
Related Articles
Sidebar rates
