A Great Chart Setup for Buyers in AUD/USD
Our GBP/USD signal is approaching the take profit target, as the USD finds some bids this morning. The US employment report, which will be..

Our GBP/USD signal is approaching the take profit target, as the USD finds some bids this morning. The US employment report, which will be the most important data release of the year so far, will be up in just a few hours.
It is likely that forex traders are closing a few of of their sell positions on the USD that had previously been opened. That being said, the USD is climbing higher.
Because our GBP/USD signal is heading for TP (take profit), we had the idea of opening another forex trade elsewhere. The chart setup in AUD/USD seemed the most favourable for buyers, so we made the decision to focus on this pair for now.
So, what’s this bullish chart setup?
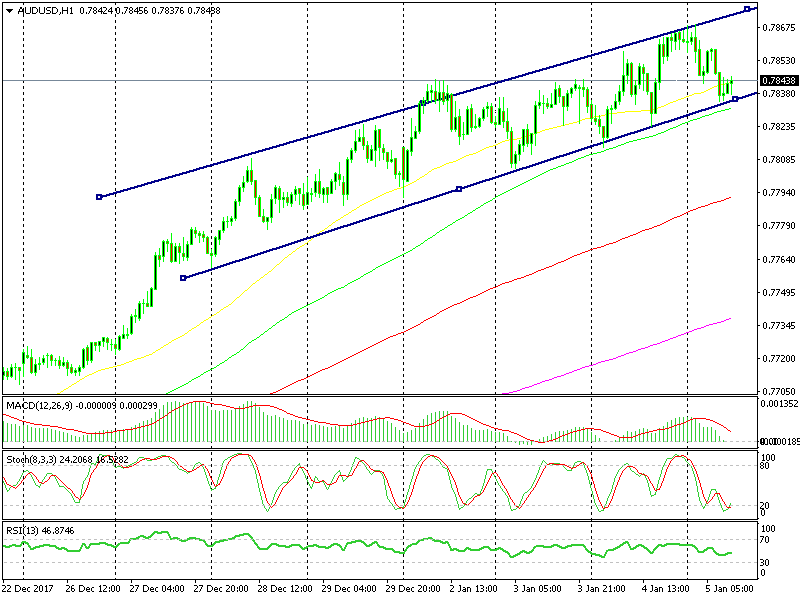
The channel is working fine
- The ascending channel
As it can be seen on the chart above, this forex pair has formed an upward channel. The tops have been getting higher, and the lows are getting higher as well. The lower trend line has been providing support, and the price is close to that line once again.
- The 100 SMA
The 100 SMA (green) has now caught up with the price, and it is providing support along with the lower trend line of the channel. It is currently standing just a few pips below the trend line.
Stochastic indicator
The stochastic indicator is currently oversold on the hourly chart- that is to say, this pair is oversold and a reverse can be expected.
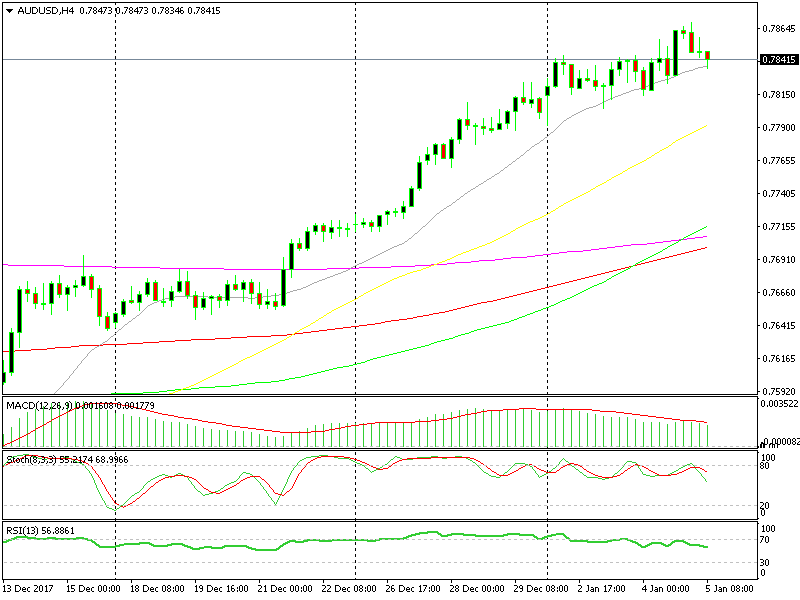
The 20 SMA has provided strong support this week
- The 20 SMA on the H4 chart
The hourly chart is now becoming bullish, and the 20 SMA (grey) on the H4 chart is the reason that the decision to go long on this pair was made. This moving average has provided solid support throughout the week. As I was looking at it yesterday, with the plan in mind to buy this pair, the price retraced lower. It retraced lower still this morning, and kissed this MA for a moment. However, the 20 SMA provided support once again.
- Hammer candlestick
The previous H4 candlestick closed as a hammer. A hammer is a reversing signal in forex textbooks. That makes it 5 bullish indicators, apart from the uptrend.
- Check out our free forex signals
- Follow the top economic events on FX Leaders economic calendar
- Trade better, discover more Forex Trading Strategies
- Open a FREE Trading Account
- Read our latest reviews on: Avatrade, Exness, HFM and XM
Related Articles
Sidebar rates
