20 SMA Gone in EUR/USD, 50 SMA Comes into Play
Similarly to the AUD/USD, the EUR/USD has made a sudden turnaround today. It failed at the 1.2080s area for the third or fourth time last Friday. It is now nearly 100 pips down from the top.
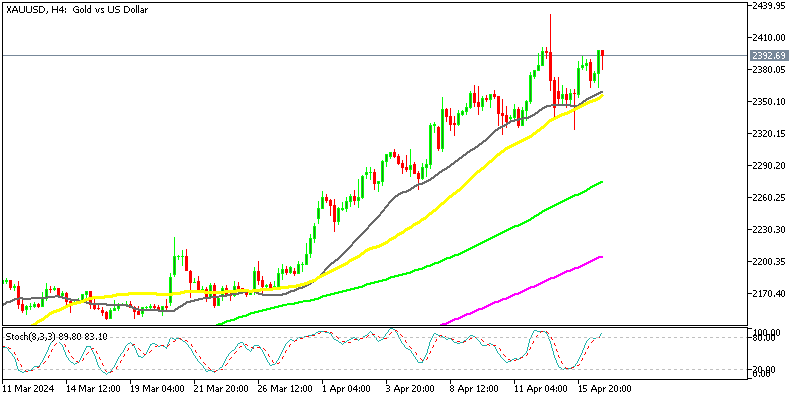
As it can be seen on the H4 chart below, the uptrend during the last few weeks has leaned against the 20 SMA (grey), as with the uptrend of the AUD/USD. The price has now broken below the 1.20 level.

The attention is on the 50 SMA now
Another moving average has come into play now that the 20 SMA is gone. The price is trading above the 50 SMA (yellow) currently. It looks like it is finding support on this moving average. Looking at this, a better idea of how moving averages work is presented. They come into play one after the other, providing support as well as resistance.
A good opportunity to go long here may have presented itself, as the stochastic indicator is oversold, and this pair jumped higher last week once that happened.

This hourly chart setup looks sort of bullish
Another indicator that points in the direction of a possible climb, or at least a decent jump higher, can be found on the H1 chart. The price is finding support at the 100 smooth MA (red), and the previous hourly candlestick formed a doji (a reversing signal.)
Based on this information, there is a case to be made here for a short term buy signal. Buying here and targeting the other two moving averages, (green and yellow). They are standing at around 1.2040-50, would currently be the best bet for going long. The stop would very likely be 30-40 pips lower, and the risk/reward ratio justifies this trade.


