
A Bearish Chart Pattern on EUR/GBP. Going Short Now


EUR/GBP made quite a reversal last week, reversing higher right at the 100 smooth MA (red) after the daily chart had formed a pin candlestick. At that time, the stochastic indicator was also oversold. The reverse occurred midweek, and by Friday, the pair had climbed more than 100 pips.
The Stochastic Indicator
Currently, it seems that another pattern is forming, this time bearish. The stochastic indicator is not overbought yet, but it’s heading in that direction. If today’s candlestick closes as it is, tomorrow the stochastic indicator will surely be overbought, making for a bearish signal.
The Candlesticks
Yesterday’s daily candlestick proved to be yet another bearish signal. It closed as a doji, which is a reversing signal, after several bullish candles. It looks as though today’s candlestick will close as a doji as well, which will strengthen the current bearish setup.
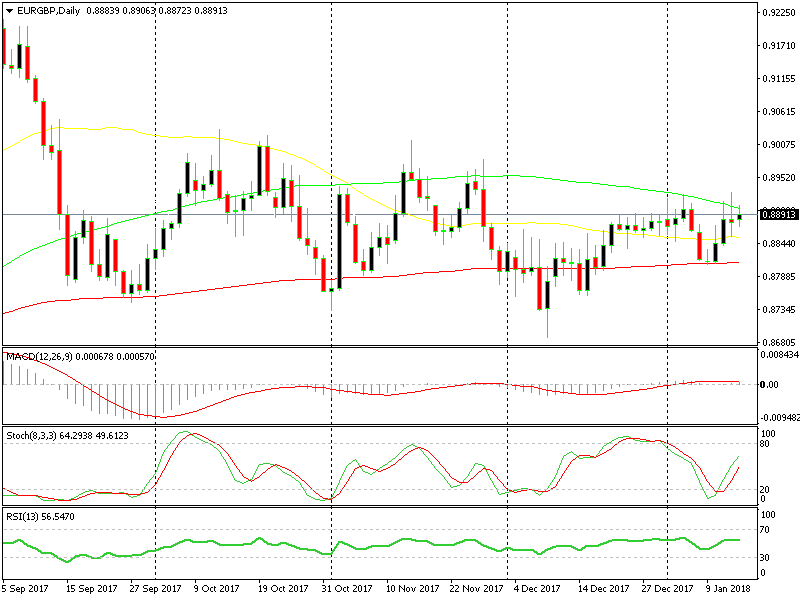
There are three bearish signals in this chart
The 100 SMA
The strongest bearish signal is the 100 simple MA (green). This moving average has been providing strong resistance over the course of the last three days, and had also provided resistance back in November- these things together make for a strong technical indicator.
We opened a sell forex signal a few minutes ago, and currently the price action is looking good, as we are approximately 10 pips in profit, so we’re letting it roll.


