Gold Takes Advantage Of A Weaker Greenback – The Technical Outlook
Gold began trading bullish once the dollar had reached its high against a basket of currencies...
Gold began trading bullish once the dollar had reached its high against a basket of currencies. As we can recall, the price action was majorly impacted by the news that the Bank of Japan would cut the Japanese government bonds buying program, as well as the US corporate debt. Investors, therefore,are now selling the dollar and moving to JPY due to speculation that country’s central bank may wind down its monetary stimulus this year.
XAUUSD – Technical View
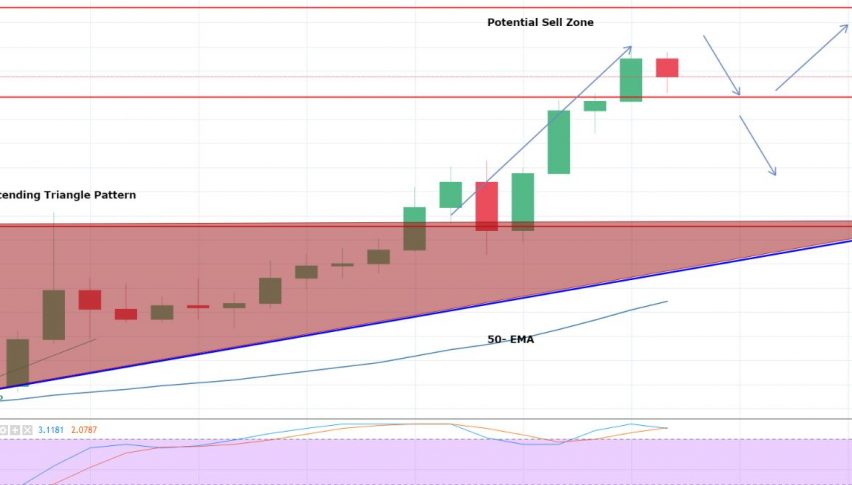
On the 4- hour chart, we can see that Gold broke out of the ascending triangle pattern at $1,326, and lead the metal to a multi-month high of $1,344. The Gold, technically speaking, would need to plunge to $1,332 in order to continue its bullish trend.
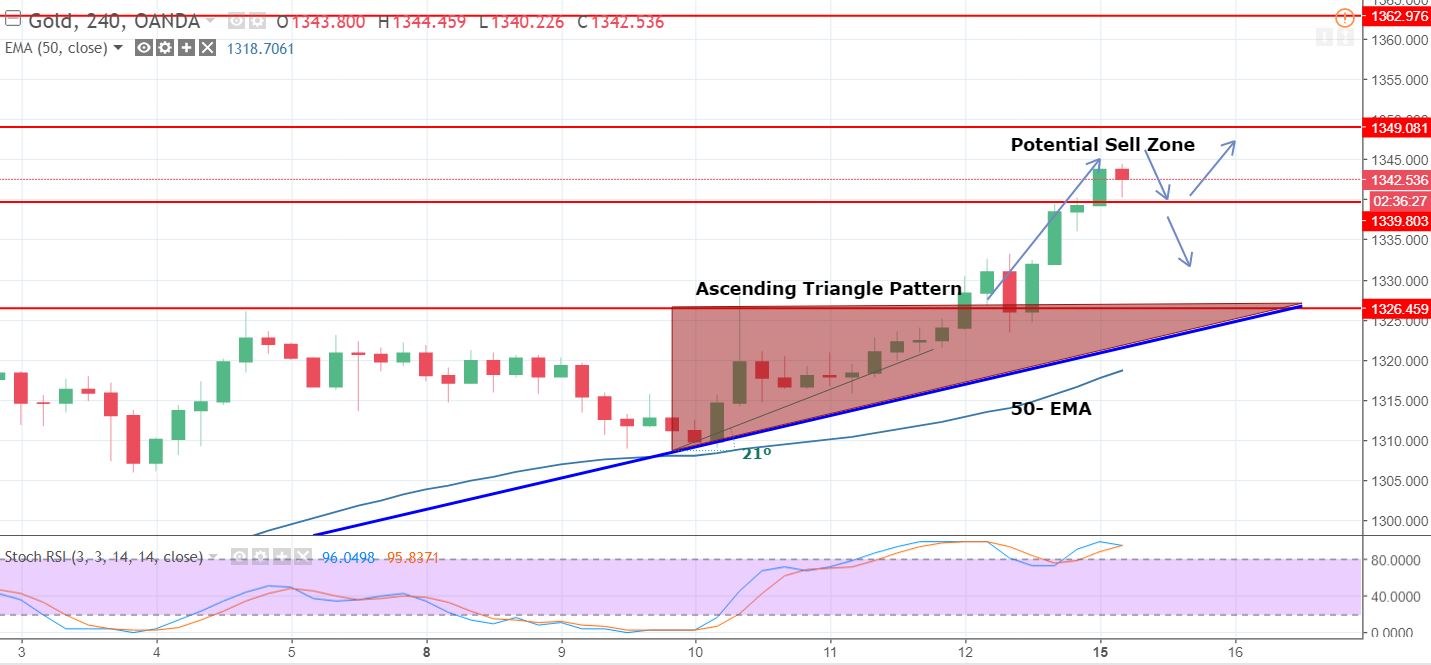
Gold – 4- Hour Chart
The leading indicators, both the RSI and Stochastics are holding at the top overbought zone.
Gold is likely to face a resistance of $1,349 on the horizontal trendline.
There is currently a huge divergence between the 50 – periods EMA, and the CMP. This means that technically, the price of gold should be at $1,320.
Gold // XAUUSD – Trading Plan
It’s quite difficult to predict the investor’s sentiment currently, as the US banks are closed, and the only activity we see in the market is due to noise traders. The $1,347 should be monitored, as Gold may drop below this with a stop above $1,351, and take profit at $1,339, $1,332. Good luck.
- Check out our free forex signals
- Follow the top economic events on FX Leaders economic calendar
- Trade better, discover more Forex Trading Strategies
- Open a FREE Trading Account
- Read our latest reviews on: Avatrade, Exness, HFM and XM
Related Articles


Sidebar rates
Related Posts
